RackPeek
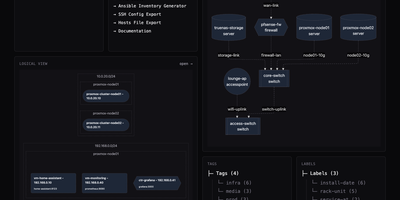
Every server, switch port, virtual machine, and network VLAN in a homelab or small IT environment can be cataloged, visualized, and exported through RackPeek's unified web interface and command-line toolkit. Operators record rack-mounted servers, managed switches, routers, firewalls, wireless access points, and uninterruptible power supplies alongside their CPU, memory, and storage specifications in a clean browser dashboard. Beyond physical gear, the inventory tracks operating systems, containerized or bare-metal services, IP subnets, and port-to-port cable connections while organizing assets with searchable tags and key-value labels. From that structured inventory, the interactive visualization engine renders live physical wiring diagrams and logical subnet-grouped service maps that export directly as high-resolution PNG graphics or Mermaid flowcharts. Because all state lives in a single human-readable configuration file backed by built-in Git repository synchronization, teams can version-control infrastructure changes or push automated updates through the authenticated REST API with dry-run diff previews. Day-to-day administration becomes faster with built-in generators that turn your cataloged hosts into ready-to-use Ansible inventory files, SSH client configurations, and tag-filtered hosts tables. Line-and-column validation feedback in the web editor catches schema mistakes immediately before changes are committed. Running on a dedicated VPS on RepoCloud with guaranteed CPU, RAM, and SSD, full root SSH access, and a browser serial console. AGPL-3.0 licensed.
Deploy