
LobsterBoard
LobsterBoard lets you assemble custom monitoring dashboards from 50 pre-built widgets using a visual drag-and-drop editor, covering everything from CPU and memory gauges to AI subscription trackers, stock tickers, and camera feeds on your own server with zero cloud dependencies. The snap-grid editor handles layout composition with resize handles and a property panel, so you drag widgets onto a canvas, configure their data sources, and the dashboard is live. Real-time system statistics flow through Server-Sent Events, updating CPU load, memory pressure, disk usage, network throughput, and Docker container status without page refreshes. Five built-in themes range from a dark default to a retro CRT terminal aesthetic, a warm sepia paper look, and pastel options for different display environments. The template gallery lets you export complete dashboard layouts with auto-captured screenshot previews, share them with other users, and import configurations as a full replacement or selective merge. Custom pages extend beyond dashboards into notes, kanban boards, or any free-form layout you need. Built-in widgets connect to iCal feeds for calendar events, RSS sources for news aggregation, weather APIs for local conditions, and financial data providers for cryptocurrency and stock prices. The whole system runs from a single server.cjs file with zero cloud dependencies or external frameworks. Running on a dedicated VPS on RepoCloud with guaranteed CPU, RAM, and SSD, full root SSH access, and a browser serial console. BSL-1.1 licensed (free for non-commercial use; converts to MIT in 2030).
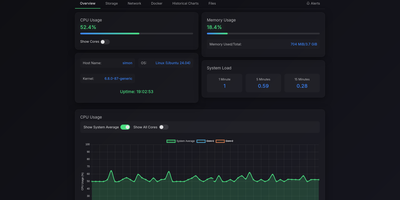
Simon
Simon is a lightweight self-hosted system monitor that shows live CPU, memory, disk, and network metrics for your server and its Docker containers in one web dashboard, with threshold alerts and a built-in file browser. Open the dashboard to watch real-time gauges alongside historical charts, so a slow memory leak becomes visible hours before it takes a service down. Every running container appears with its own CPU and memory stats, and its logs open in a searchable viewer, so routine diagnosis never needs a terminal session on the host. The file browser lets you navigate the directories you choose to expose, preview file contents, upload with drag and drop, create folders, and move or delete items. Downloads support range requests, which means large files resume cleanly after a dropped connection and media files stream instead of failing halfway. Alert rules fire when CPU, memory, disk, or network activity crosses thresholds you set, and notifications arrive through Telegram, ntfy, Gotify, Pushover, Pushbullet, Matrix, or any custom webhook. Prebuilt notification templates get common setups running in minutes, and password authentication keeps the dashboard private on a public server. Resource-constrained machines benefit most: the monitor runs comfortably on single-board computers and small instances where heavier monitoring stacks would consume the very memory they exist to watch. Running on a dedicated VPS on RepoCloud with guaranteed CPU, RAM, and SSD, full root SSH access, and a browser serial console. MIT licensed.