Apache Doris
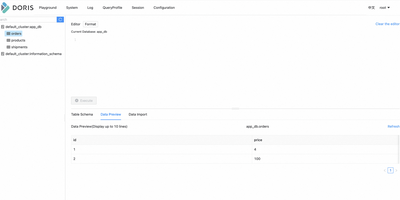
Dashboards should not wait minutes for yesterday's data, so Apache Doris answers analytical SQL over fresh data with a massively parallel, fully vectorized engine that processes column batches instead of row after row. Frontends receive queries over the MySQL protocol, plan them with a cost-based optimizer, and coordinate execution, while Backends store columnar tablets and run scans, joins, and aggregations in parallel pipelines across cores. Data lands continuously through stream and batch loads, broker imports from object storage, and change capture from operational databases, and it is queryable immediately for reporting that reflects the last minutes rather than the last nightly job. Tables outside Doris join the same SQL through catalogs for Hive, Iceberg, Paimon, Hudi, and JDBC sources, with local caching and materialized views accelerating the lakehouse queries your team runs every day. Search workloads live here too: an inverted index and a SEARCH function provide full-text retrieval, vector indexes support similarity search, and AI functions call language models from SQL for extraction and summarization, so hybrid queries mix keywords, semantics, and structured filters in one statement. Workload groups, resource controls, and compute-storage separation in cloud mode keep interactive dashboards fast while heavy ETL spills safely to disk. Running on a dedicated VPS on RepoCloud with guaranteed CPU, RAM, and SSD, full root SSH access, and a browser serial console. Apache-2.0 licensed.
Apache Druid
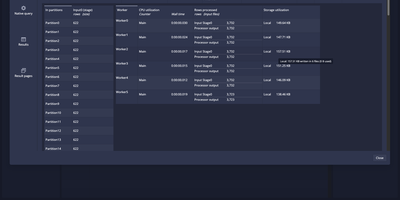
When dashboards must answer in under a second over billions of streaming events, Apache Druid is the real-time analytics database built for the job. Point a supervisor at an Apache Kafka topic or Amazon Kinesis stream and events are queryable on arrival, late data included, with exactly-once guarantees. Batch loads run as SQL: INSERT and REPLACE statements ingest files, and EXTERN reads external sources. Schema auto-discovery adds new columns and types as data lands. Joins run at ingestion or at query time. A web console gathers the daily work in one place: a tabbed Query view with EXPLAIN PLAN and query history, a Connect external data wizard, and pages for datasources, segments, retention rules, supervisors, tasks, services, and lookups. Configurable tiers place hot and cold data on different hardware. Quality-of-service settings shield priority workloads from heavy ones. Clickstream analytics, ad campaign reporting, network telemetry, application performance tracking, and IoT metrics all fit. Applications connect over the HTTP SQL API or the Avatica JDBC driver, and native JSON queries remain available for advanced needs. Running on a dedicated VPS on RepoCloud with guaranteed CPU, RAM, and SSD, full root SSH access, and a browser serial console. Apache-2.0 licensed.