Open Report
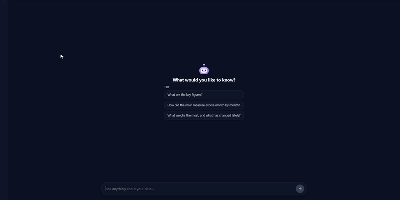
Open source reporting where an AI answers questions in plain words, builds whole dashboards page by page, and shows where a number comes from, while the data stays in your own databases. Ask what weighs the most and what has changed lately, in any language, and the answer arrives with its chart, a table view, and a button that adds it to a report. Describe the report you need and the assistant asks which pages you want, then builds the visuals, measures, data model, and look, ready to fine-tune on the canvas. Bring a local model through Ollama or LM Studio, any OpenAI-compatible API, Anthropic, or your Claude subscription, and decide how much of your data it may read: the schema only, cached aggregates, or query results. Connect Snowflake, BigQuery, Databricks, ClickHouse, Oracle, SQL Server, and MySQL, or load CSV, Excel, Parquet, and JSON files, then define joins with cardinality, dimensions, measures, and row-level security once for every report. The free canvas offers more than fifteen visual types, custom visuals, multi-page layouts, themes, cross-filtering, drill-down, and scheduled cache refreshes. Workspaces with viewer, editor, and admin roles, public links, PDF, PNG, and Excel export, and scoped API tokens cover sharing and automation, while OpenMetadata lineage maps a figure back through its bronze, silver, and gold tables. Running on a dedicated VPS on RepoCloud with guaranteed CPU, RAM, and SSD, full root SSH access, and a browser serial console. AGPL-3.0 licensed.
Deploy