Categories
Self-Hosted Data Visualization Business Intelligence Dashboards Reporting Semantic Layer AI Data Analysis Power BI AlternativeStars
Forks
Watchers
Open Report
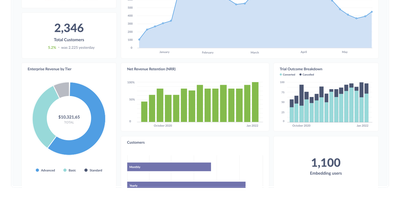
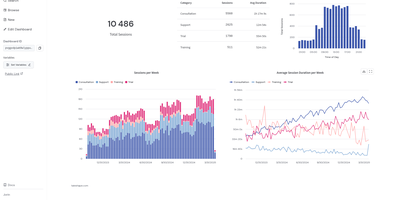
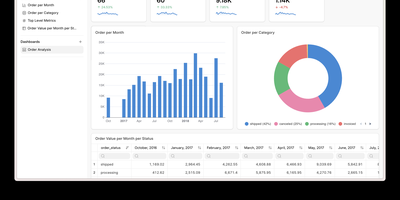
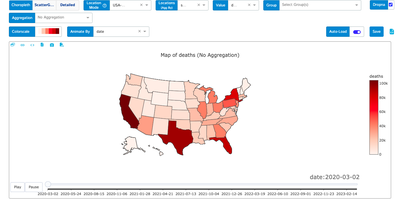
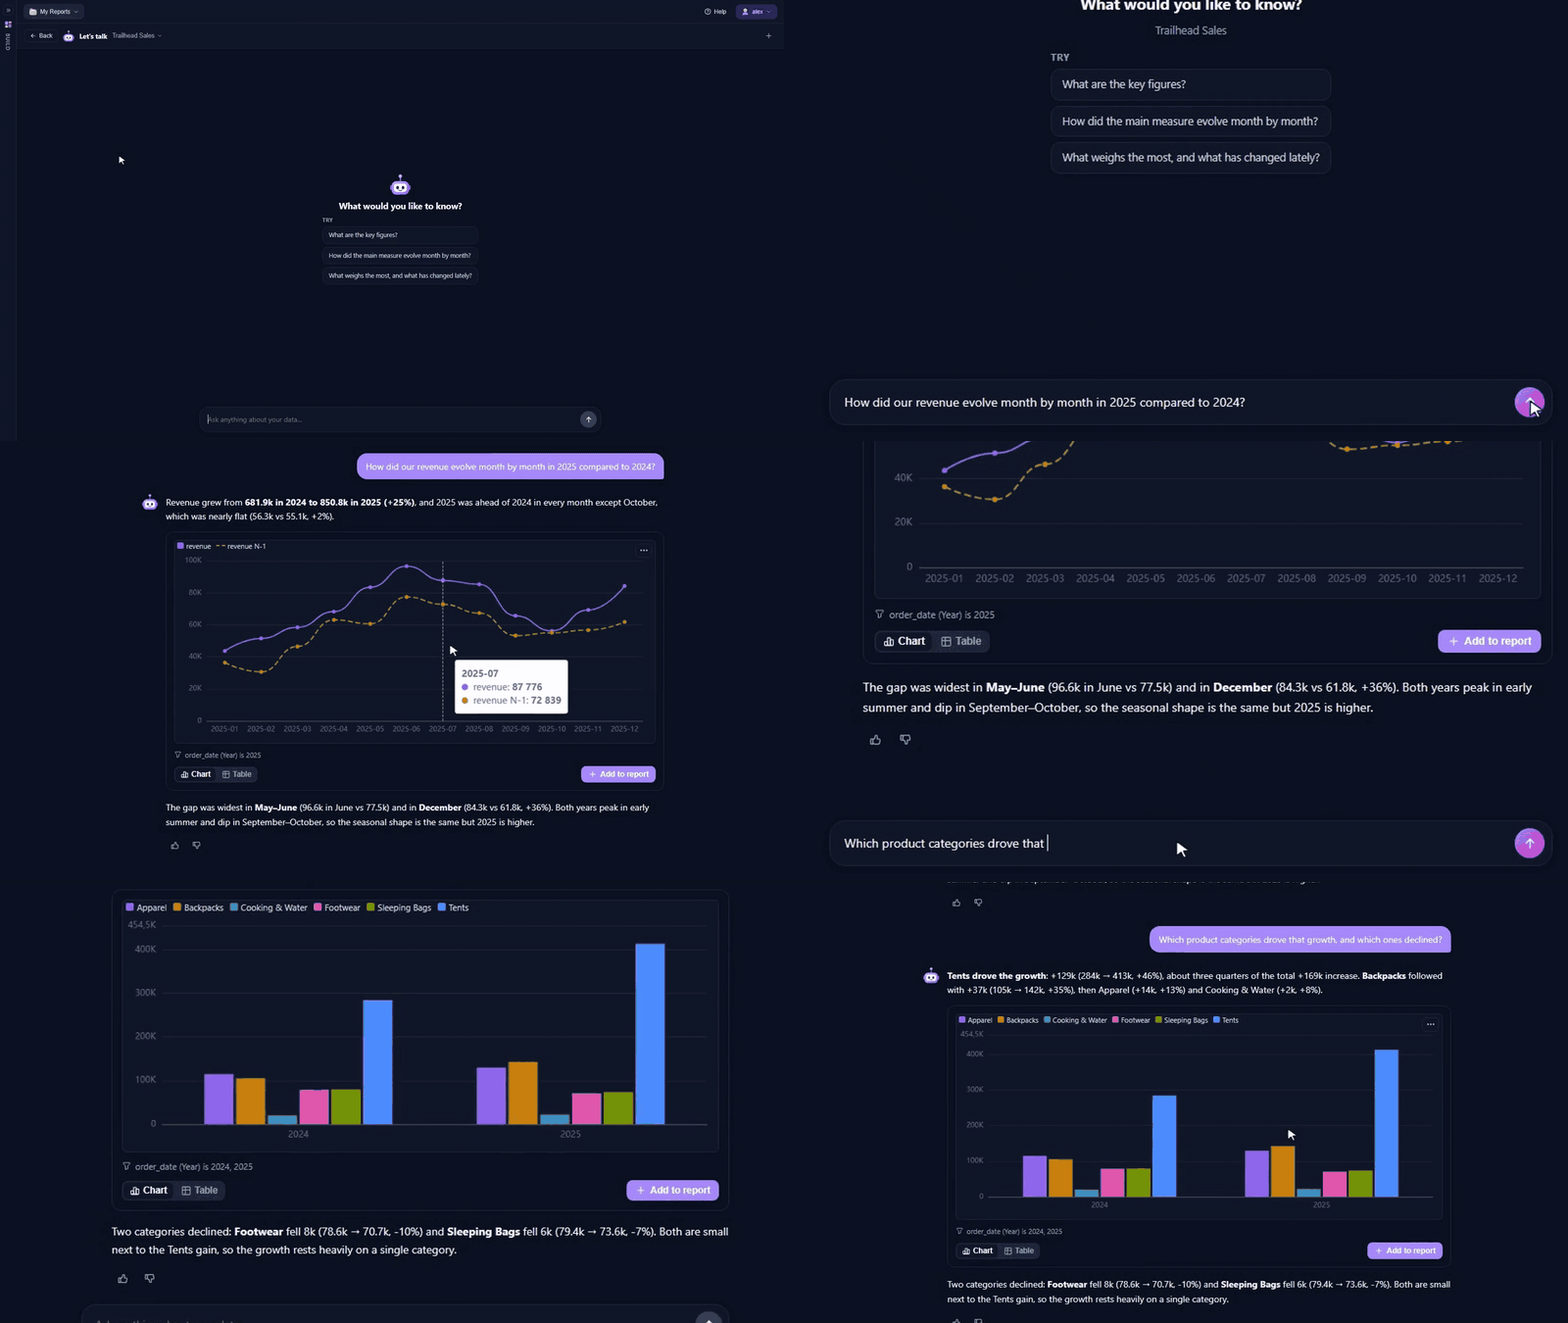
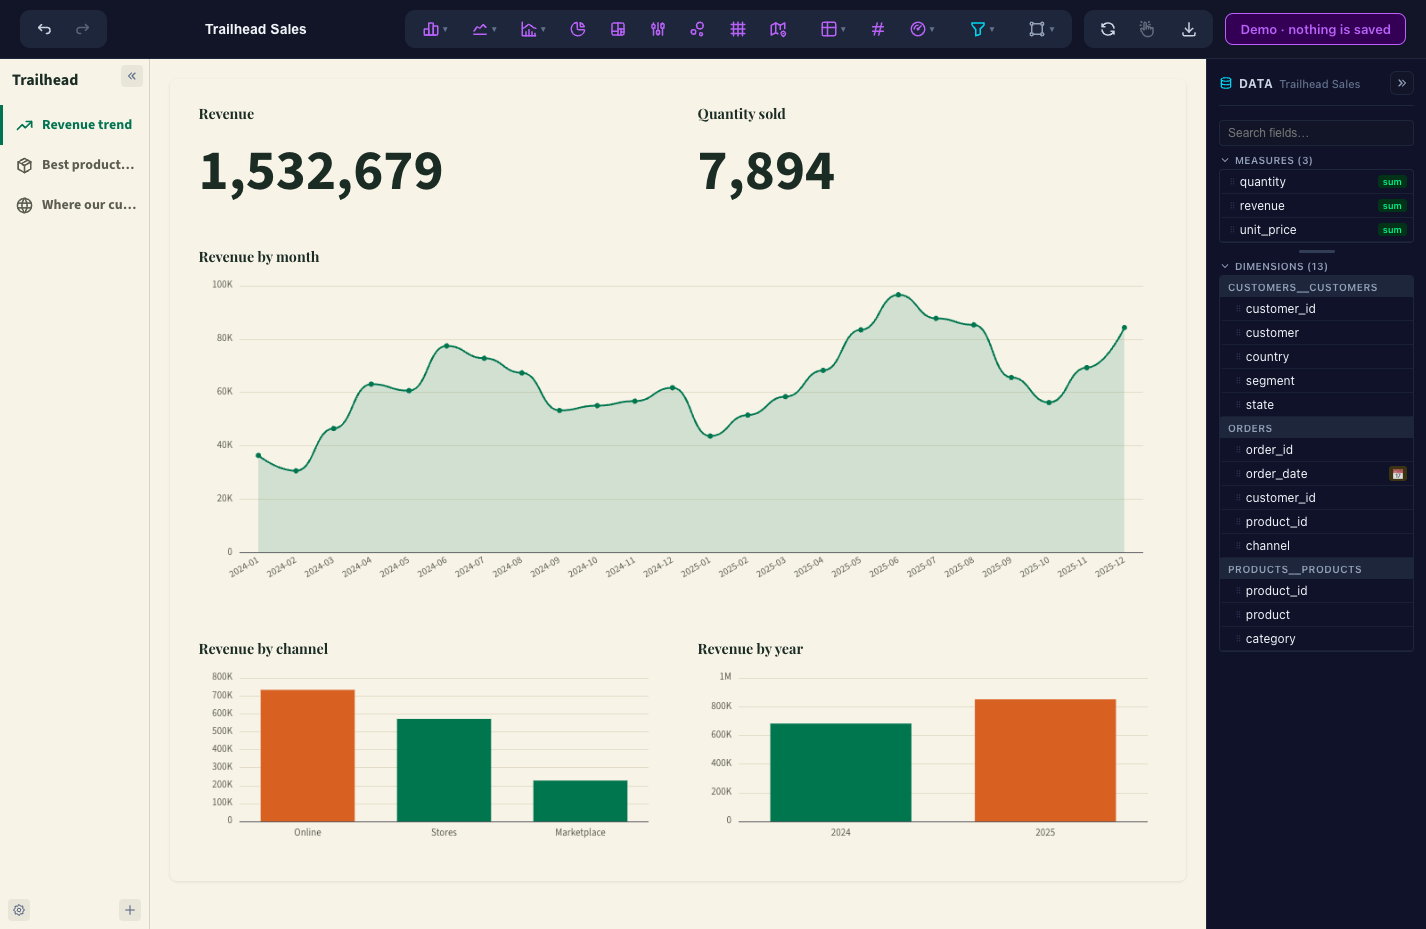
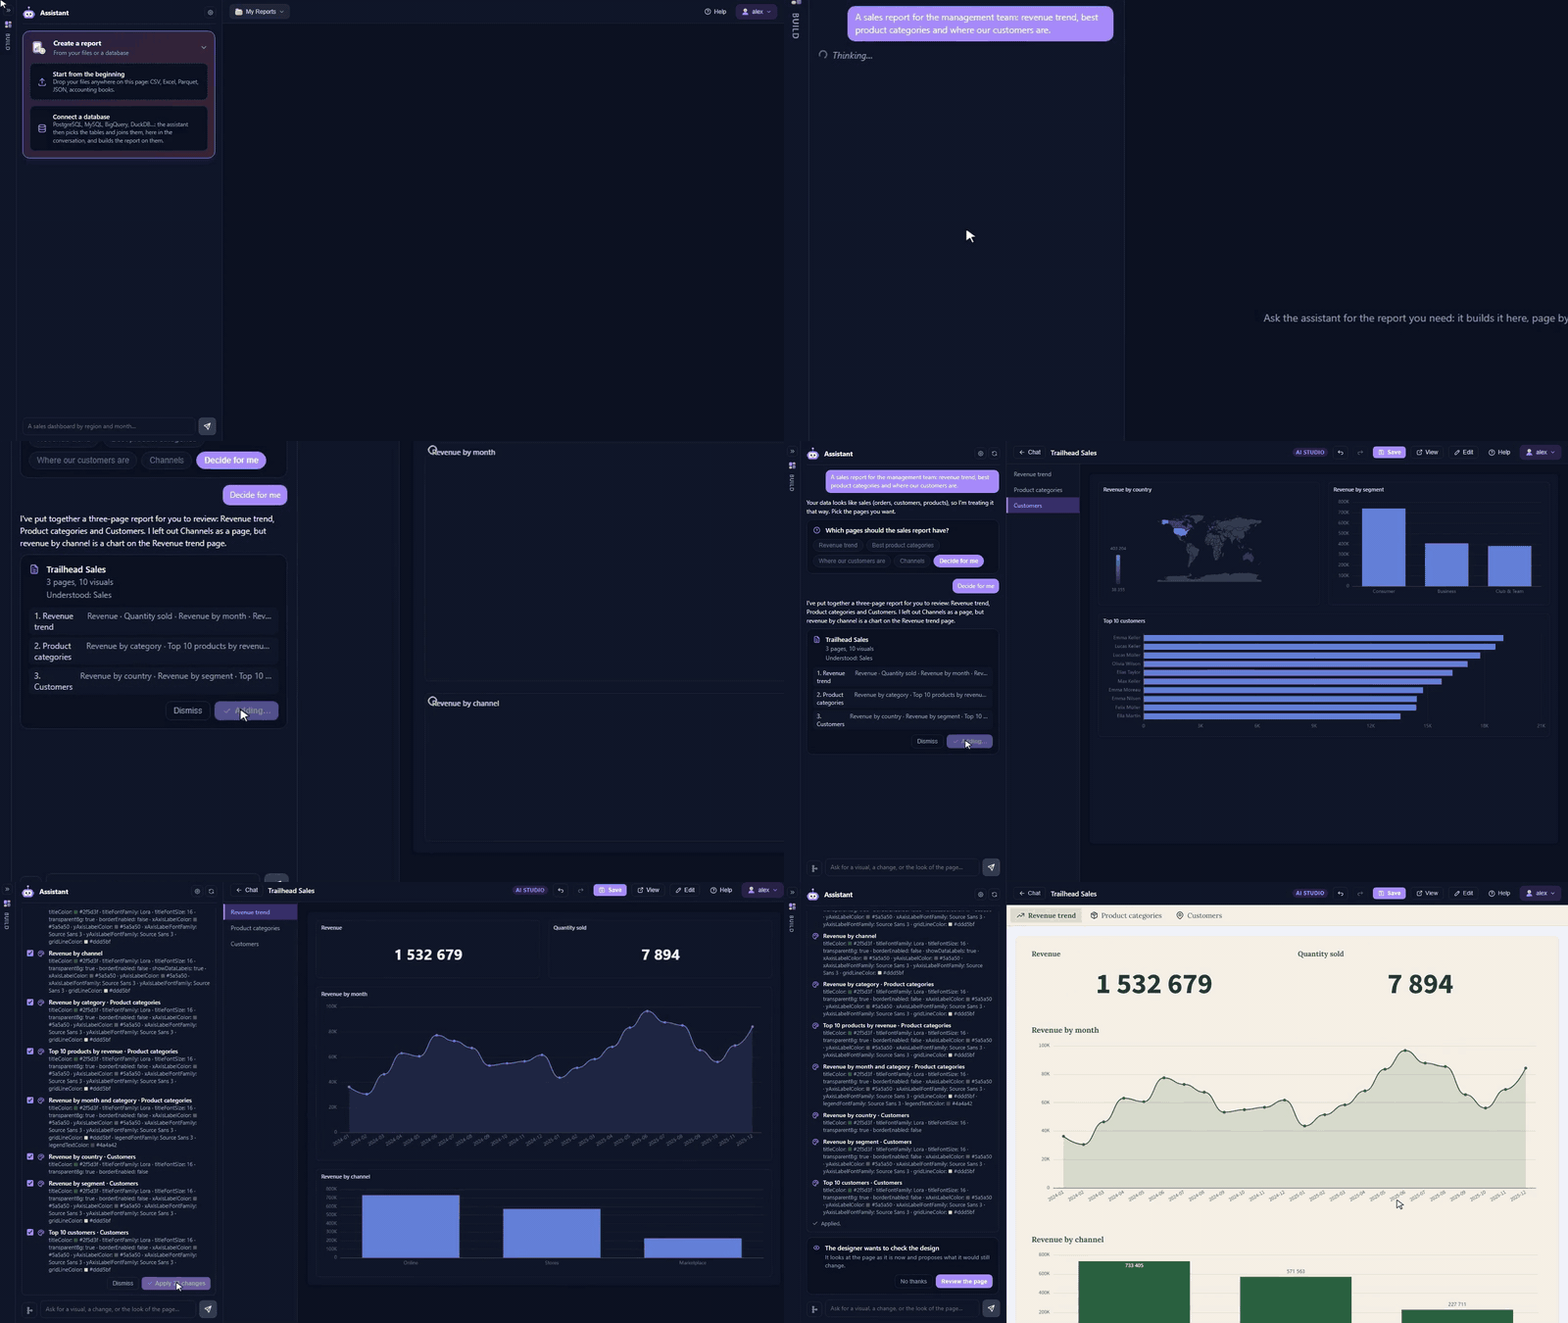
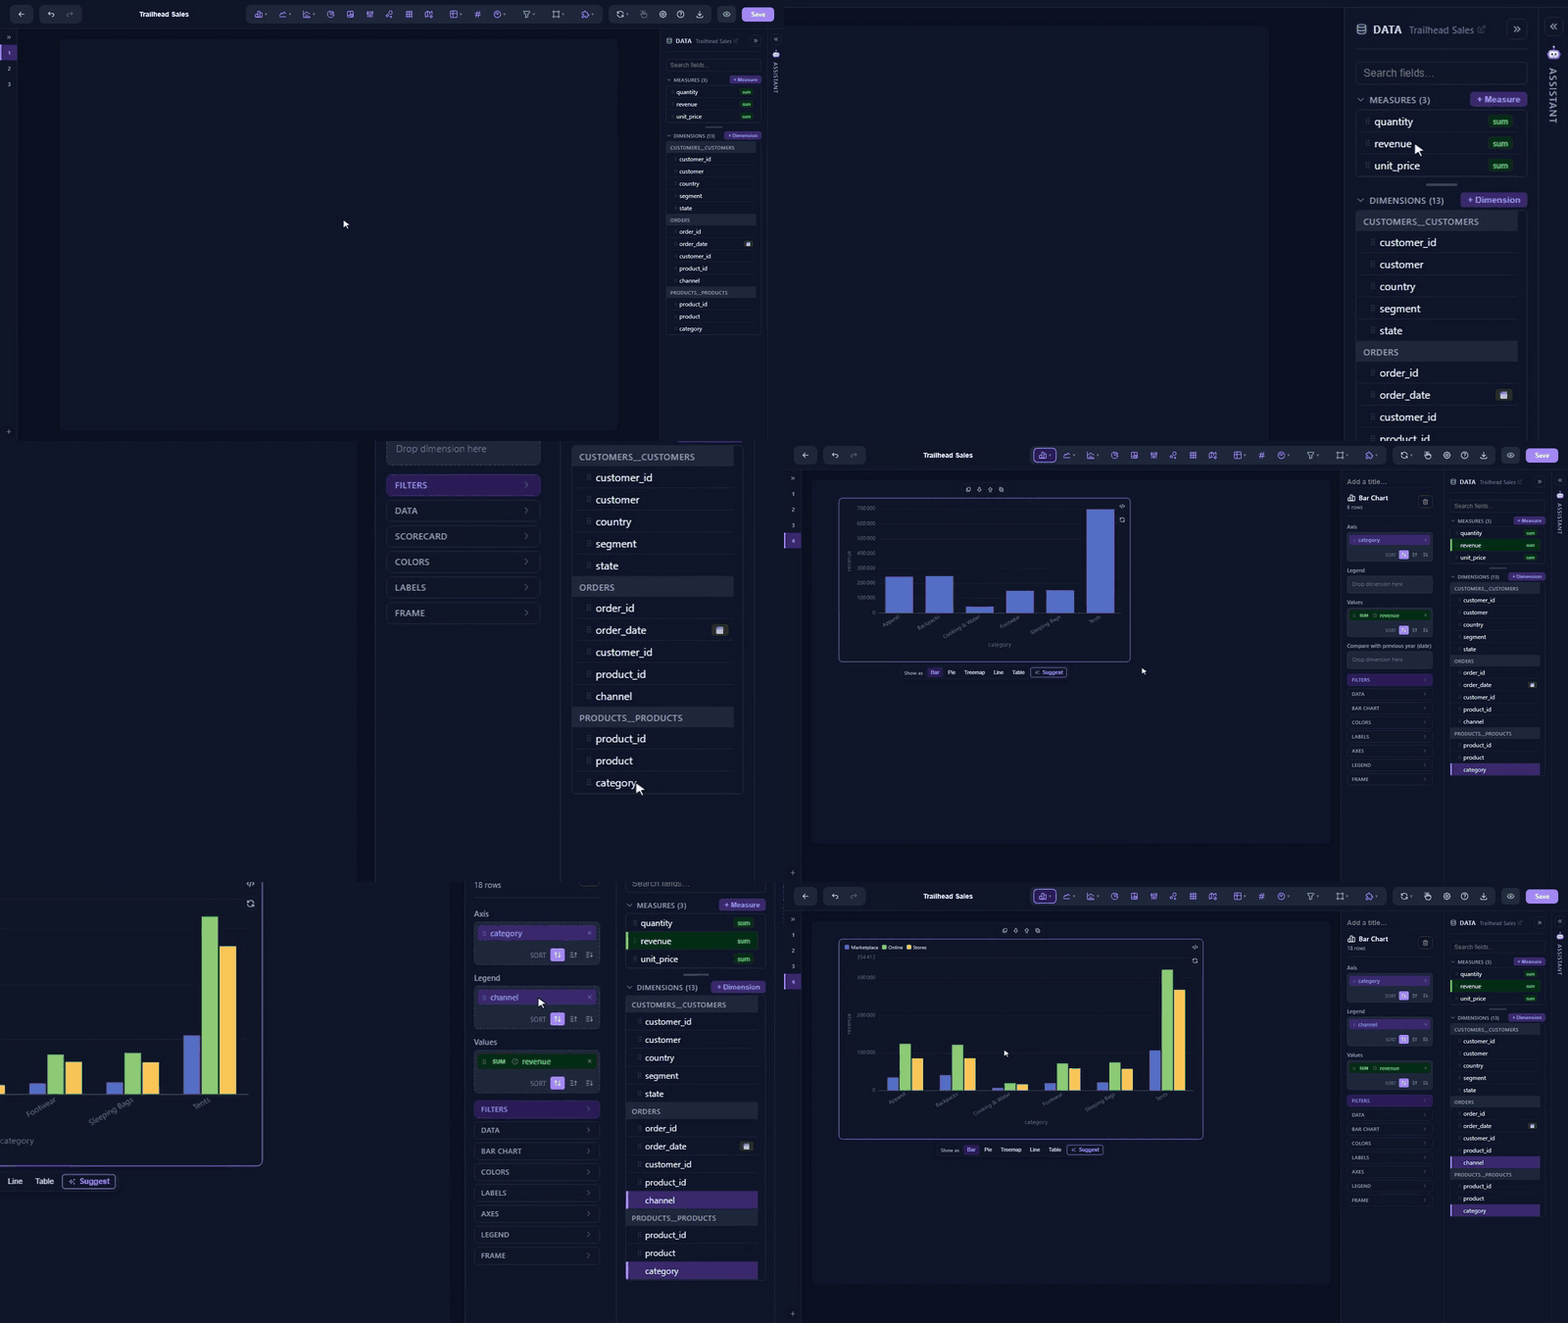
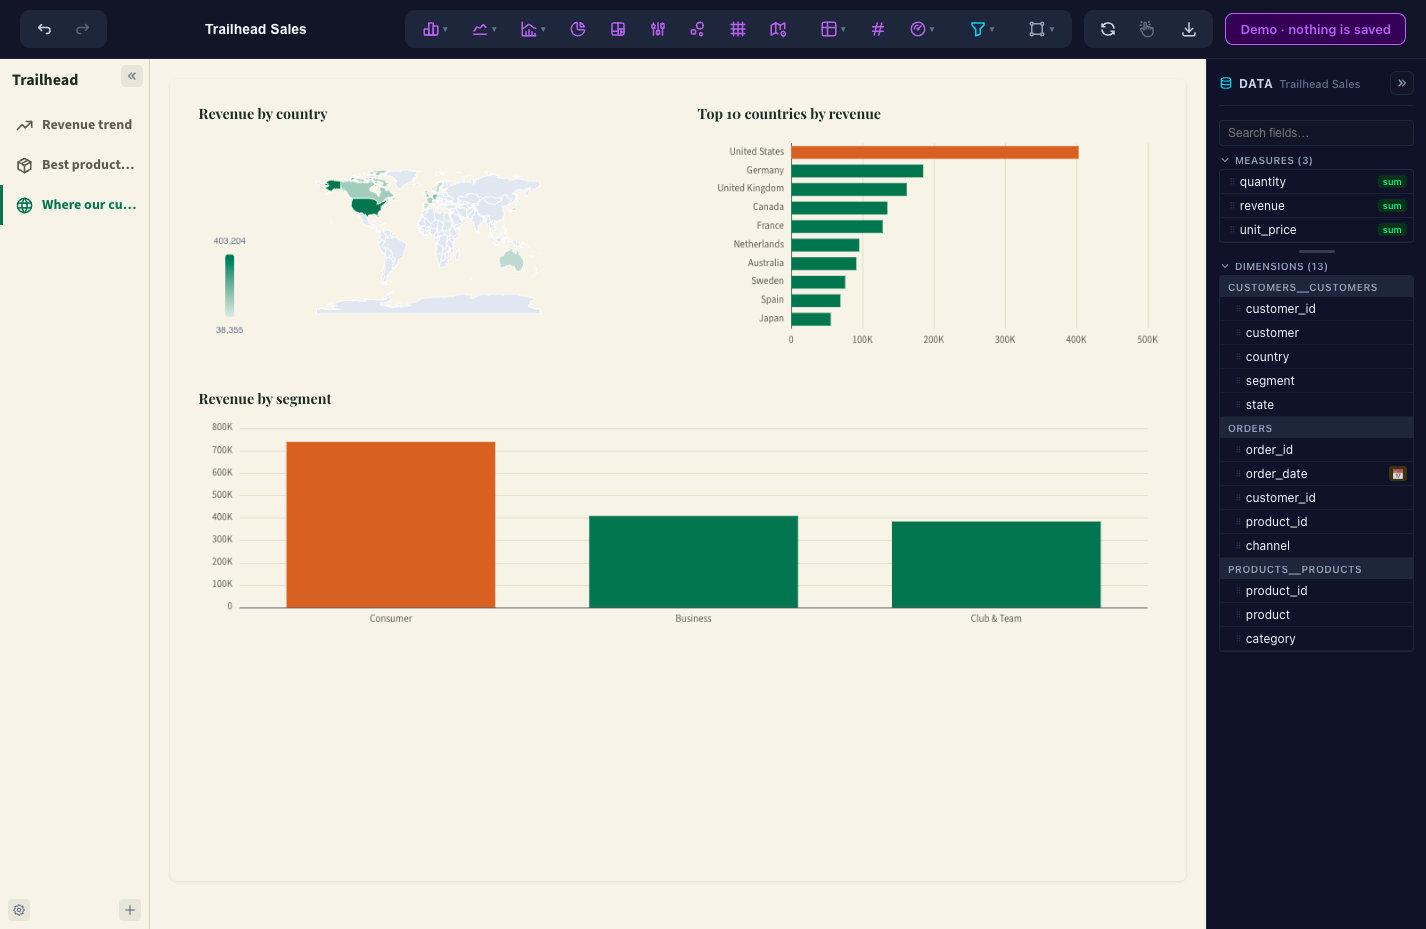
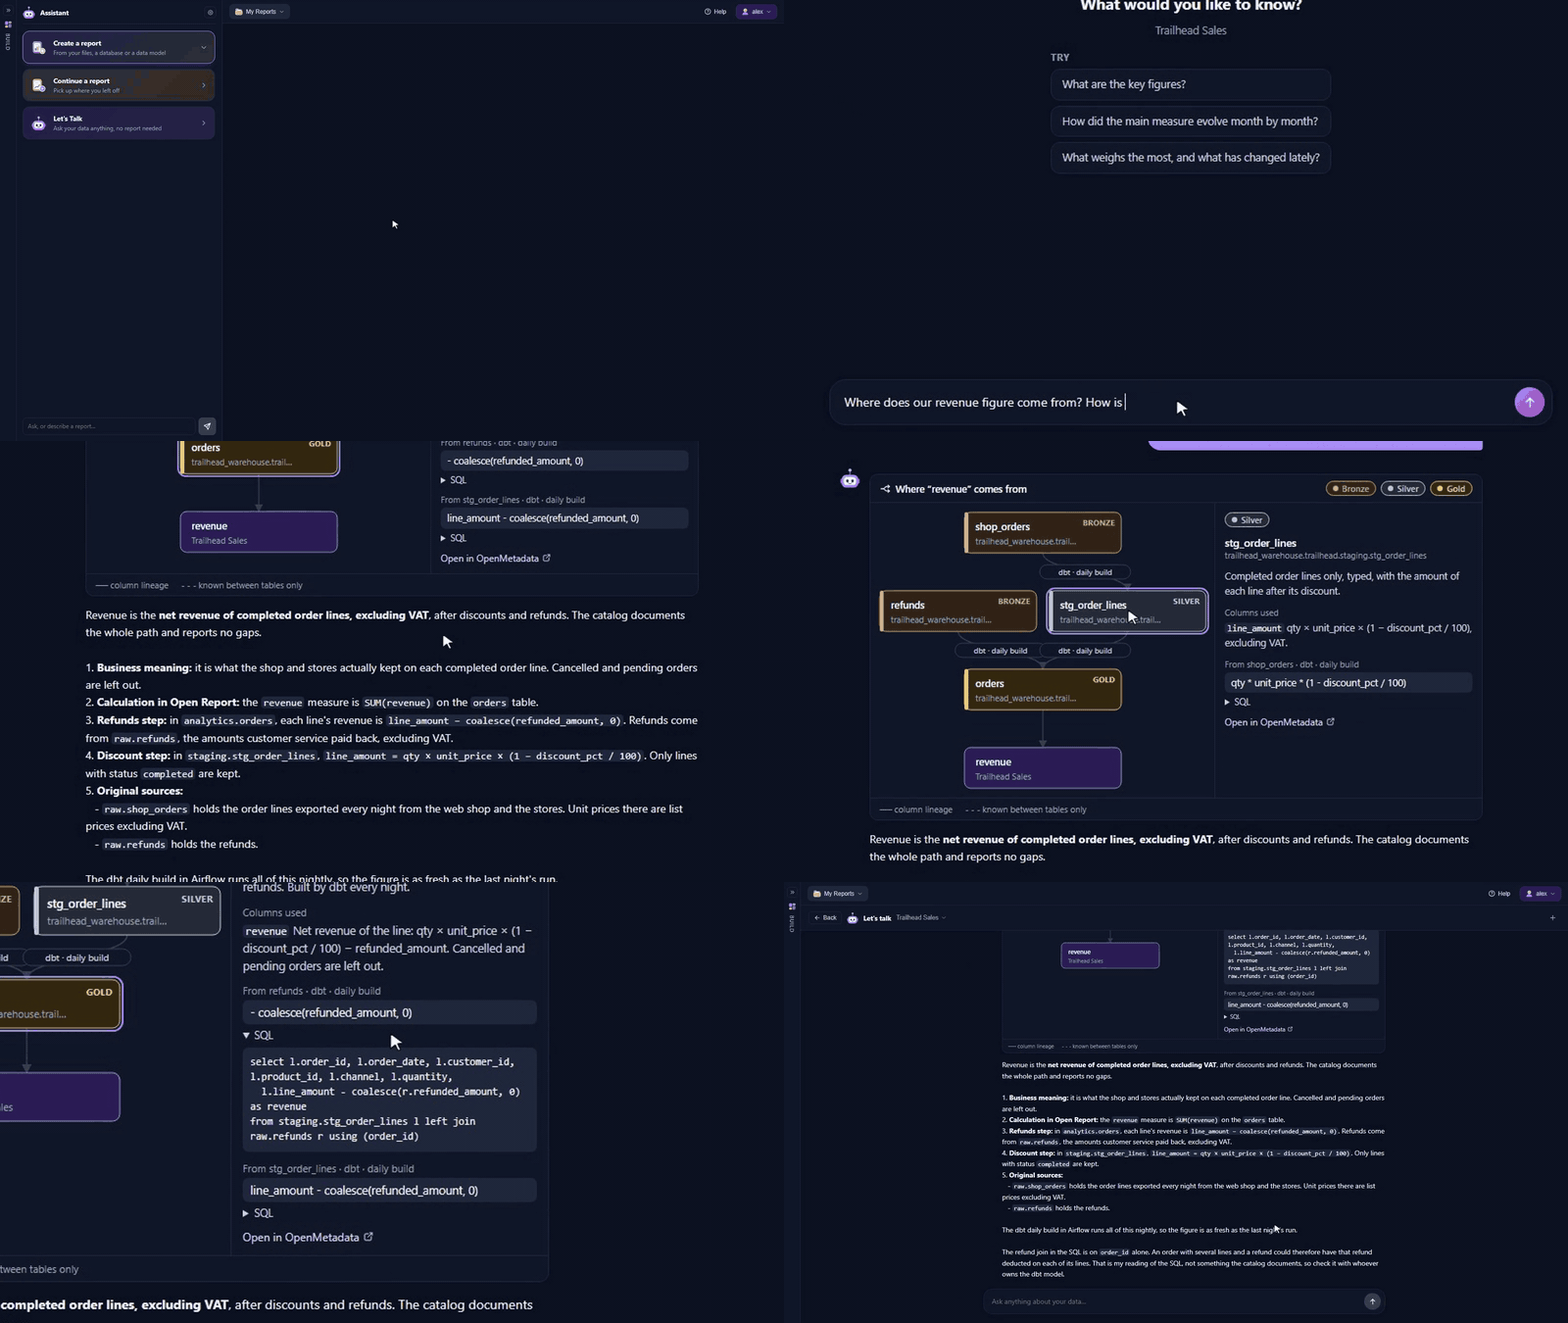
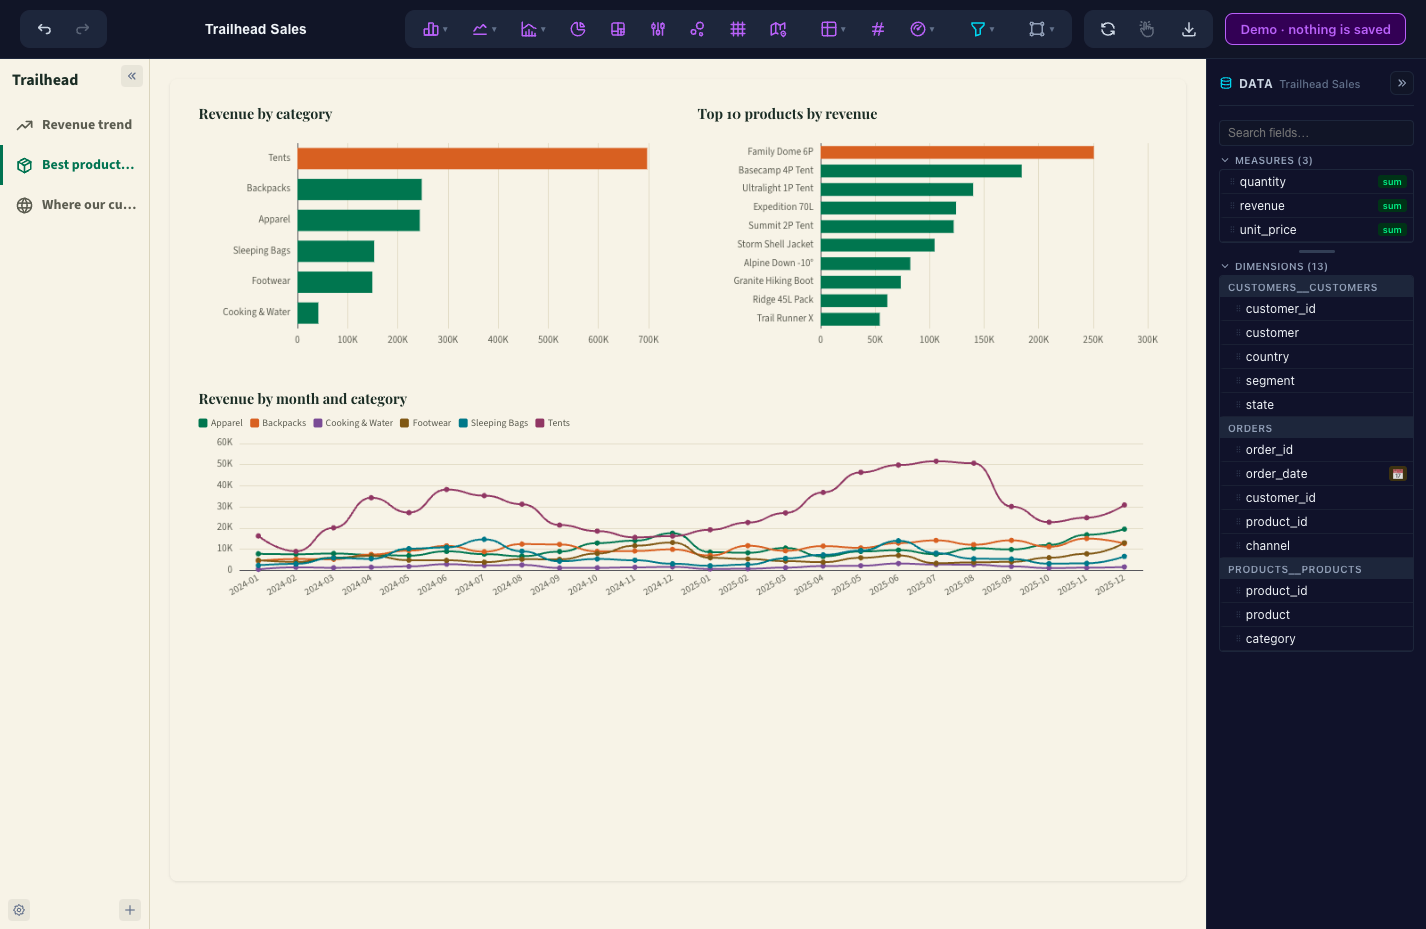
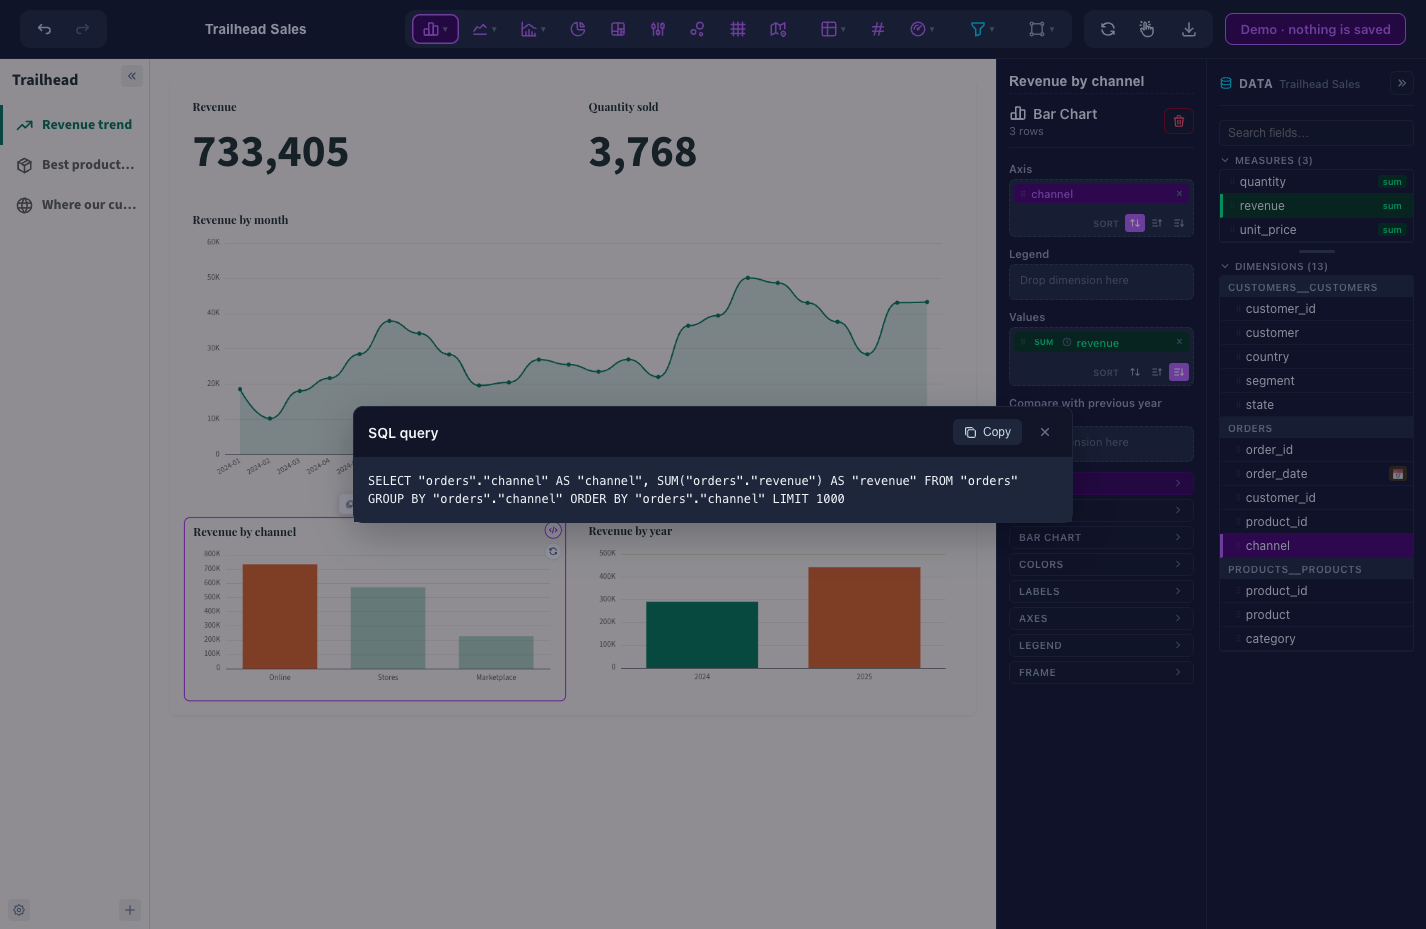
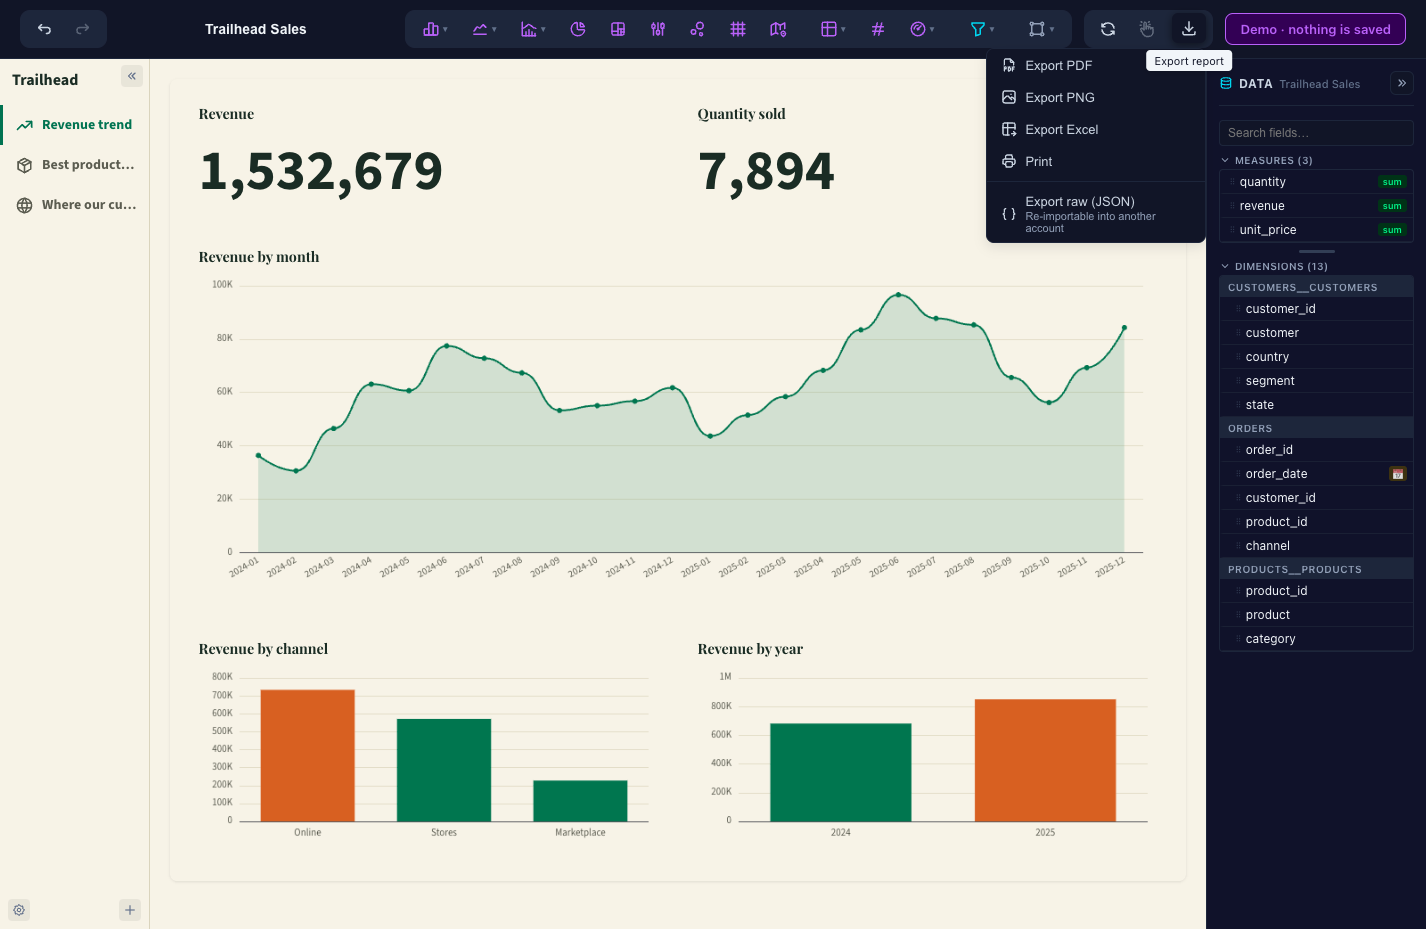
Open source reporting where an AI answers questions in plain words, builds whole dashboards page by page, and shows where a number comes from, while the data stays in your own databases. Ask what weighs the most and what has changed lately, in any language, and the answer arrives with its chart, a table view, and a button that adds it to a report. Describe the report you need and the assistant asks which pages you want, then builds the visuals, measures, data model, and look, ready to fine-tune on the canvas. Bring a local model through Ollama or LM Studio, any OpenAI-compatible API, Anthropic, or your Claude subscription, and decide how much of your data it may read: the schema only, cached aggregates, or query results. Connect Snowflake, BigQuery, Databricks, ClickHouse, Oracle, SQL Server, and MySQL, or load CSV, Excel, Parquet, and JSON files, then define joins with cardinality, dimensions, measures, and row-level security once for every report. The free canvas offers more than fifteen visual types, custom visuals, multi-page layouts, themes, cross-filtering, drill-down, and scheduled cache refreshes. Workspaces with viewer, editor, and admin roles, public links, PDF, PNG, and Excel export, and scoped API tokens cover sharing and automation, while OpenMetadata lineage maps a figure back through its bronze, silver, and gold tables. Running on a dedicated VPS on RepoCloud with guaranteed CPU, RAM, and SSD, full root SSH access, and a browser serial console. AGPL-3.0 licensed.
Benefits
- Ask your data in plain words
- Type any question in any language and receive the figures with a chart and a table view. By default the assistant reads only pre-aggregated cache data and never queries your database.
- Data stays on your own server
- Queries run from your host against your own databases and files, with no per-seat pricing and no limit on users, reports, or sources in the self-hosted edition.
- Three ways to build a report
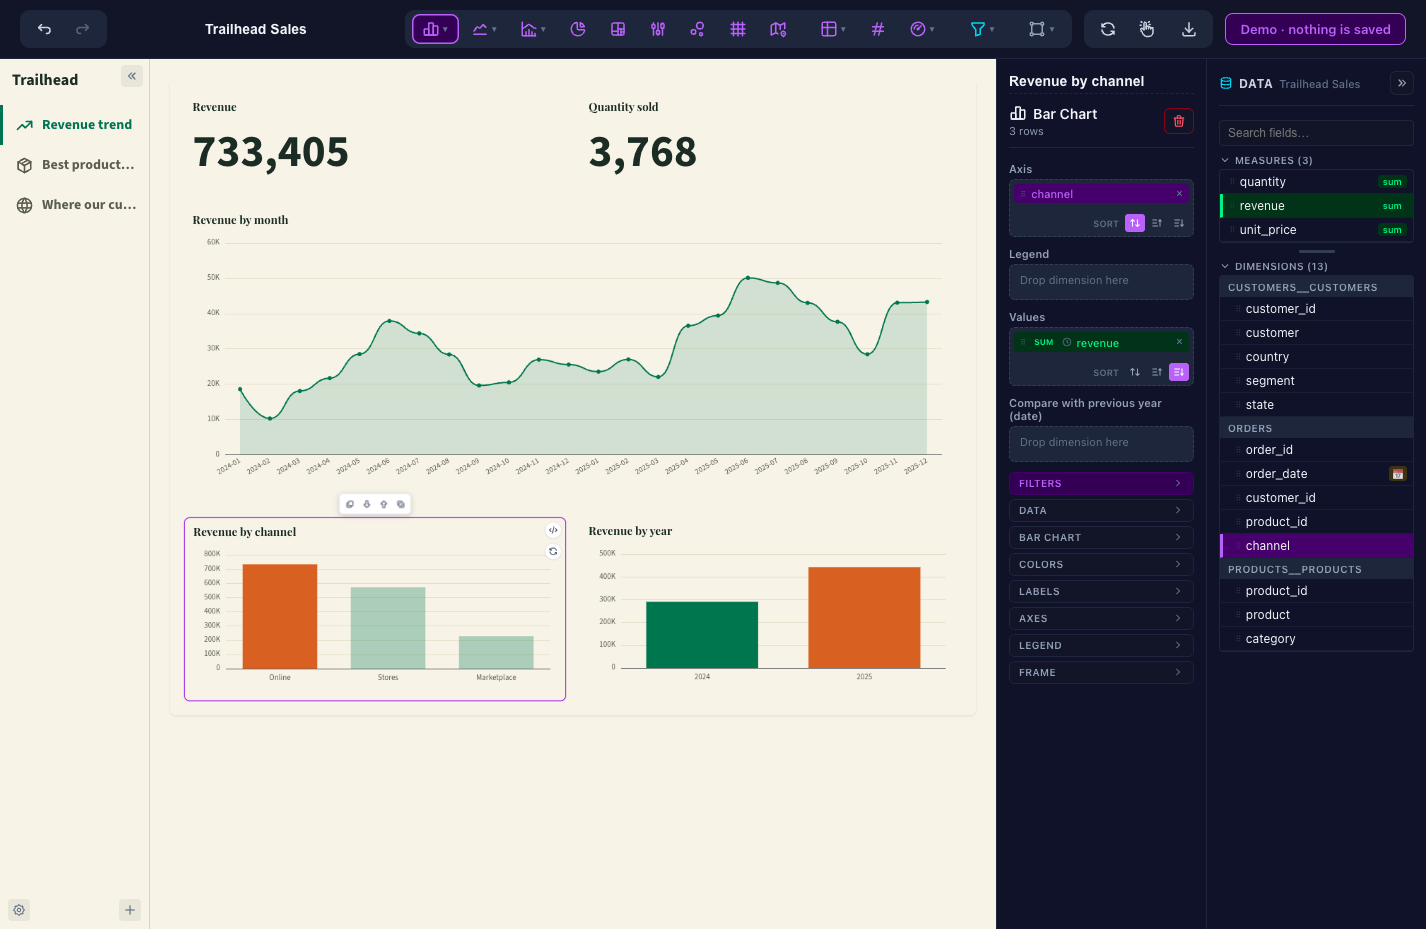
- Ask the AI to build every page, add an answer from a conversation to a report, or place and size each visual yourself on a free multi-page canvas.
- Define joins and measures once
- A semantic model holds joins with cardinality, dimensions, measures, and row-level security, so every report reuses the same definitions and each reader sees only their own rows.
Features
- Let's Talk assistant
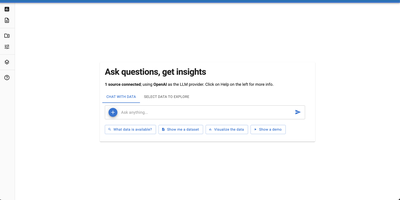
- Ask questions in plain words and get answers with charts, a table view, and an Add to report button; suggested starter questions help on a first visit.
- AI report generator
- Describe a report and the assistant asks which pages you want, then builds visuals, measures, the data model, and the look, and a designer pass can review each page.
- Semantic model editor
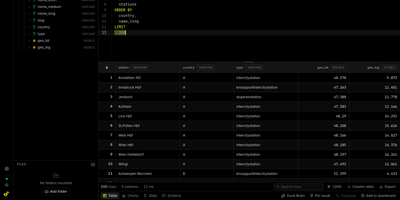
- Pick tables, draw joins with cardinality, and flag dimensions and measures once; calculated columns, CALCULATE-style filtered measures, and same-period-last-year comparisons are supported.
- Free-form report canvas
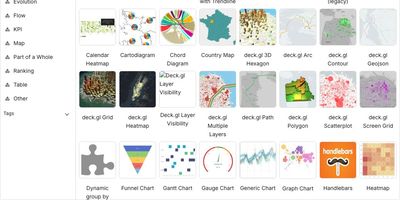
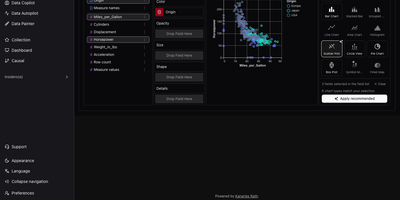
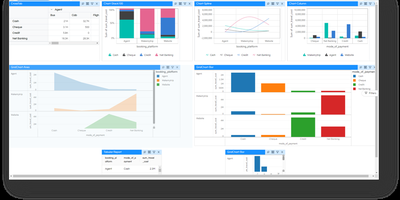
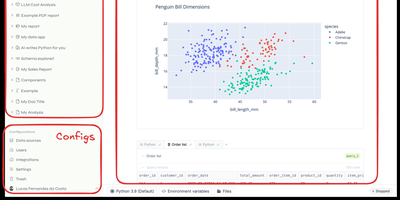
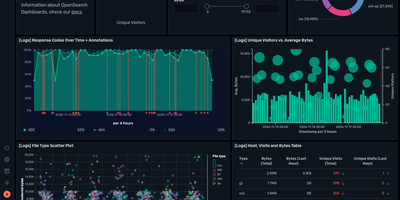
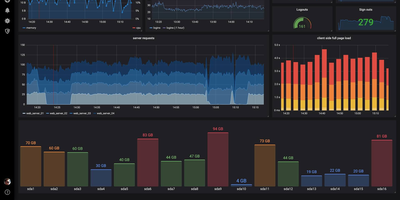
- Drag fields onto a multi-page canvas with 15+ visual types, custom visuals, themes, snap-to-grid, undo and redo, cross-filtering, and cross-highlighting.
- OpenMetadata lineage
- Ask where a figure comes from and the assistant draws the path through bronze, silver, and gold tables with column lineage and a link back to OpenMetadata.
- Exports and REST API
- Export reports to PDF, PNG, or Excel, share them through workspaces or public links, and script refreshes with scoped API tokens.