Thruk
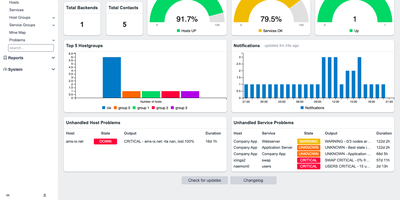
Thruk gives operations teams one fast web interface for watching hosts and services across several monitoring servers, with live status, dashboards, reports, and configuration in one place. One view combines Naemon, Icinga, Nagios, and Shinken servers, groups them by site, and reads them live. A home page of widgets shows host and service totals, gauges, notification charts, and unhandled problems, and a tactical overview adds outages and network health. Users filter, bookmark, and export status tables to Excel, and a mine map shows every host against its services as colored squares. A host page lists performance data beside actions to reschedule a check, submit a passive result, send a custom notification, or schedule downtime. Panorama dashboards place icons, graphs, and widgets on a free canvas or an OpenStreetMap, then share them with contact groups. A business process editor models an application as a tree of nodes with worst-of or best-of rules, and notifications can fire for individual steps. SLA reports in HTML and PDF go out by email on a schedule, and any page can become a recurring email report. A config tool edits hosts, services, commands, and contacts, manages users and teams, and reloads the monitoring core. Scripts reach status and commands through the REST API with API keys or through the command-line client. Running on a dedicated VPS on RepoCloud with guaranteed CPU, RAM, and SSD, full root SSH access, and a browser serial console. Artistic-1.0-Perl OR GPL-1.0-or-later licensed.
Deploy