Tracedown
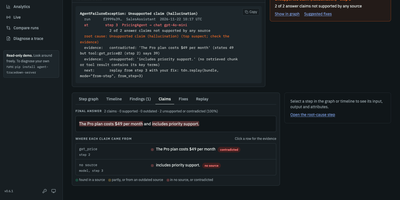
Tracedown finds the exact step that made your AI agent fail, shows the evidence, and replays the run with a fix to prove the problem is gone. Import failed runs from Langfuse, Arize Phoenix or any OpenTelemetry exporter with no code changes, or add one line to any of 13 agent frameworks, including LangGraph, CrewAI, and OpenAI Agents. A failed run turns into an AI stack trace you can paste into an issue, naming the root cause, the evidence, and whether the agent or the user was at fault. Replay re-runs the agent from the broken step with your change while earlier steps come from the recording, and the fix check repeats each suggestion three times without firing real tools. It also checks each claim against its sources, compares runs across prompt and model versions, groups failures into incidents with Slack, PagerDuty, or GitHub alerts, and reports cost per run, step, and model. Diagnosis is rules first, so it runs instantly and privately without an API key, with an optional LLM judge for sharper accuracy. Ask Claude Code or Cursor why a run failed through the built-in MCP server, and export spans over OTLP to any collector. Start as one container for a team, then scale out with Compose or a Helm chart; SSO, roles, and an audit log come included. Running on a dedicated VPS on RepoCloud with guaranteed CPU, RAM, and SSD, full root SSH access, and a browser serial console. Apache-2.0 licensed.
DataBuff
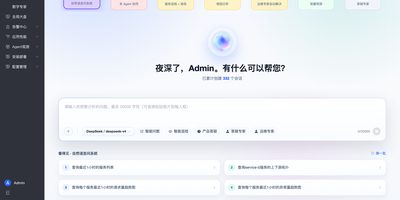
Instead of clicking through charts, you ask DataBuff which service is slowest, and the answer comes straight from live OpenTelemetry traces, metrics, topology, and alerts. The AI Brain runs query and inspection experts in parallel and merges their findings into one forwardable report. Global topology turns failing services red, and service flow shows who calls whom, down to databases, caches, and queues. Click a latency spike to open the matching traces, then read the span waterfall to find the slowest span. The Slow SQL tab ranks statements by call count, and error analysis groups failures by exception type. Alert rules apply thresholds or change detection to error rate, latency, or request count, and alerts resolve themselves when metrics recover. Any alert shows related traces and logs, offers AI root-cause analysis, and can post JSON to a webhook. Telemetry arrives over OTLP from OpenTelemetry SDKs, Collectors, Nginx, or an eBPF DaemonSet, and SkyWalking agents connect through their native gRPC. Cursor and Claude Code call 15 platform tools over MCP, and Prometheus, SkyWalking, or Zabbix join custom digital experts. A key under Model Settings switches the AI on, with Kimi, DeepSeek, GLM, Ollama, or other OpenAI-compatible endpoints behind it. One Docker command installs ingest, storage, and the web platform, with Kubernetes and offline installs also available. Running on a dedicated VPS on RepoCloud with guaranteed CPU, RAM, and SSD, full root SSH access, and a browser serial console. AGPL-3.0 licensed.