Daily Stars Explorer
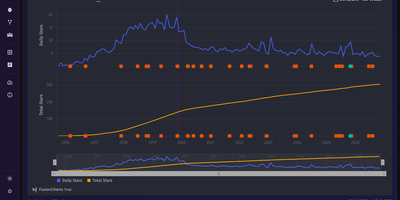
From a one-day Hacker News spike to a decade of steady growth, Daily Stars Explorer charts any GitHub repository's star history day by day, next to the releases and mentions that explain it. Type an owner and repository name, and daily and cumulative stars appear. Range shortcuts: 10Y, 5Y, YTD, QTD, MTD, and All. Zoom with a draggable lower navigator, switch to a Log Y axis, and read the stars gained inside the selected window. Transforms reshape the series. A trend line projects 30 days ahead. Yearly, monthly, or weekly grouping. Peak normalization. LOESS smoothing. Running average and median. First and second derivatives. Weekly growth rate. Feed overlays, enabled by optional provider credentials, mark releases and mentions from Hacker News, Reddit, GitHub, and YouTube right on the curve. Compare two already-fetched repositories on shared axes, with an aggregate selector, Log Y, and optional star milestones, then copy the link. With a GitHub token, separate pages chart commits, with the longest gap highlighted on demand, plus pull requests, issues, forks, and contributors. Global activity counts the public repositories or pull requests created on GitHub each day. Featured repos lists Hacker News and Reddit posts that link to GitHub projects, sortable by points, comments, or date. Star history, commit, and activity charts export to CSV or JSON. Favorite repositories can be pinned. Running on a dedicated VPS on RepoCloud with guaranteed CPU, RAM, and SSD, full root SSH access, and a browser serial console. MIT licensed.
Deploy