Icinga Web 2
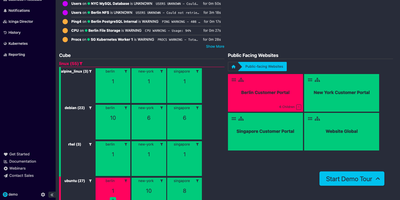
Icinga Web 2 is the browser interface for Icinga monitoring, giving operations teams one place to see which hosts and services are failing, how long they have been down, and what to fix first. Service problems, host problems, and summary tiles share a single dashboard page, and any filtered view can be added to a dashboard or the menu. Host and service lists switch between minimal, common, detailed, and table layouts, sort by severity, and filter through a search bar that autocompletes and accepts wildcards. A click on a service opens details beside the list, with plugin output, check statistics, performance data, comments, downtimes, and custom variables, plus buttons for Check Now, Comment, Downtime, and Reschedule. Modal dialogs keep acknowledgements and scheduled downtimes in context, and bulk operations act on a whole filtered list. The Tactical Overview condenses host and service states into two donut charts, and the Event Overview lists state changes and recoveries with their check output. Modules add Business Processes that group hosts and services into AND and OR trees, plus Cube, Director, Reporting, Notifications, and Kubernetes views. Roles combine permissions, refusals, and restrictions so each team sees only its own hosts, and logins run through Active Directory, LDAP, a database, or the web server. Language, time zone, and light or dark mode are set per user. Running on a dedicated VPS on RepoCloud with guaranteed CPU, RAM, and SSD, full root SSH access, and a browser serial console. GPL-3.0 licensed.
Thruk
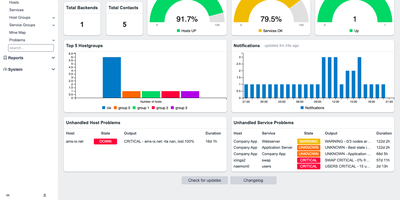
Thruk gives operations teams one fast web interface for watching hosts and services across several monitoring servers, with live status, dashboards, reports, and configuration in one place. One view combines Naemon, Icinga, Nagios, and Shinken servers, groups them by site, and reads them live. A home page of widgets shows host and service totals, gauges, notification charts, and unhandled problems, and a tactical overview adds outages and network health. Users filter, bookmark, and export status tables to Excel, and a mine map shows every host against its services as colored squares. A host page lists performance data beside actions to reschedule a check, submit a passive result, send a custom notification, or schedule downtime. Panorama dashboards place icons, graphs, and widgets on a free canvas or an OpenStreetMap, then share them with contact groups. A business process editor models an application as a tree of nodes with worst-of or best-of rules, and notifications can fire for individual steps. SLA reports in HTML and PDF go out by email on a schedule, and any page can become a recurring email report. A config tool edits hosts, services, commands, and contacts, manages users and teams, and reloads the monitoring core. Scripts reach status and commands through the REST API with API keys or through the command-line client. Running on a dedicated VPS on RepoCloud with guaranteed CPU, RAM, and SSD, full root SSH access, and a browser serial console. Artistic-1.0-Perl OR GPL-1.0-or-later licensed.