Stars
Forks
Watchers
Developer links
Parseable
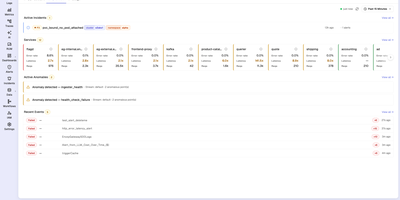
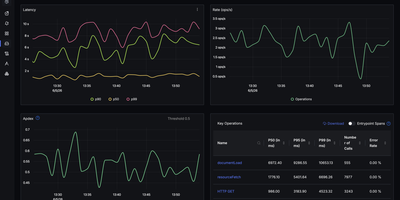
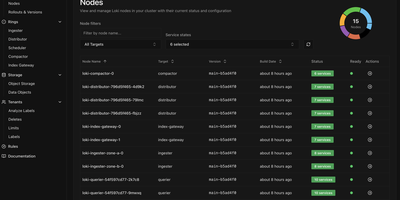
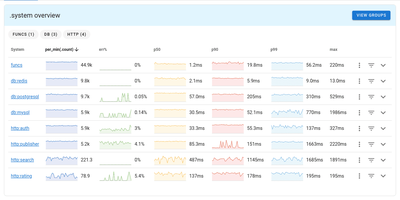
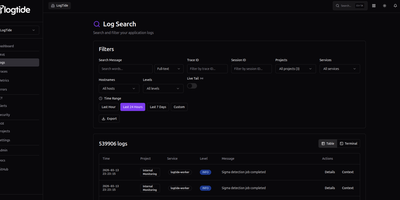
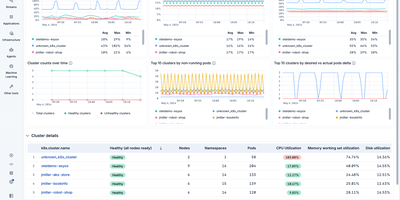
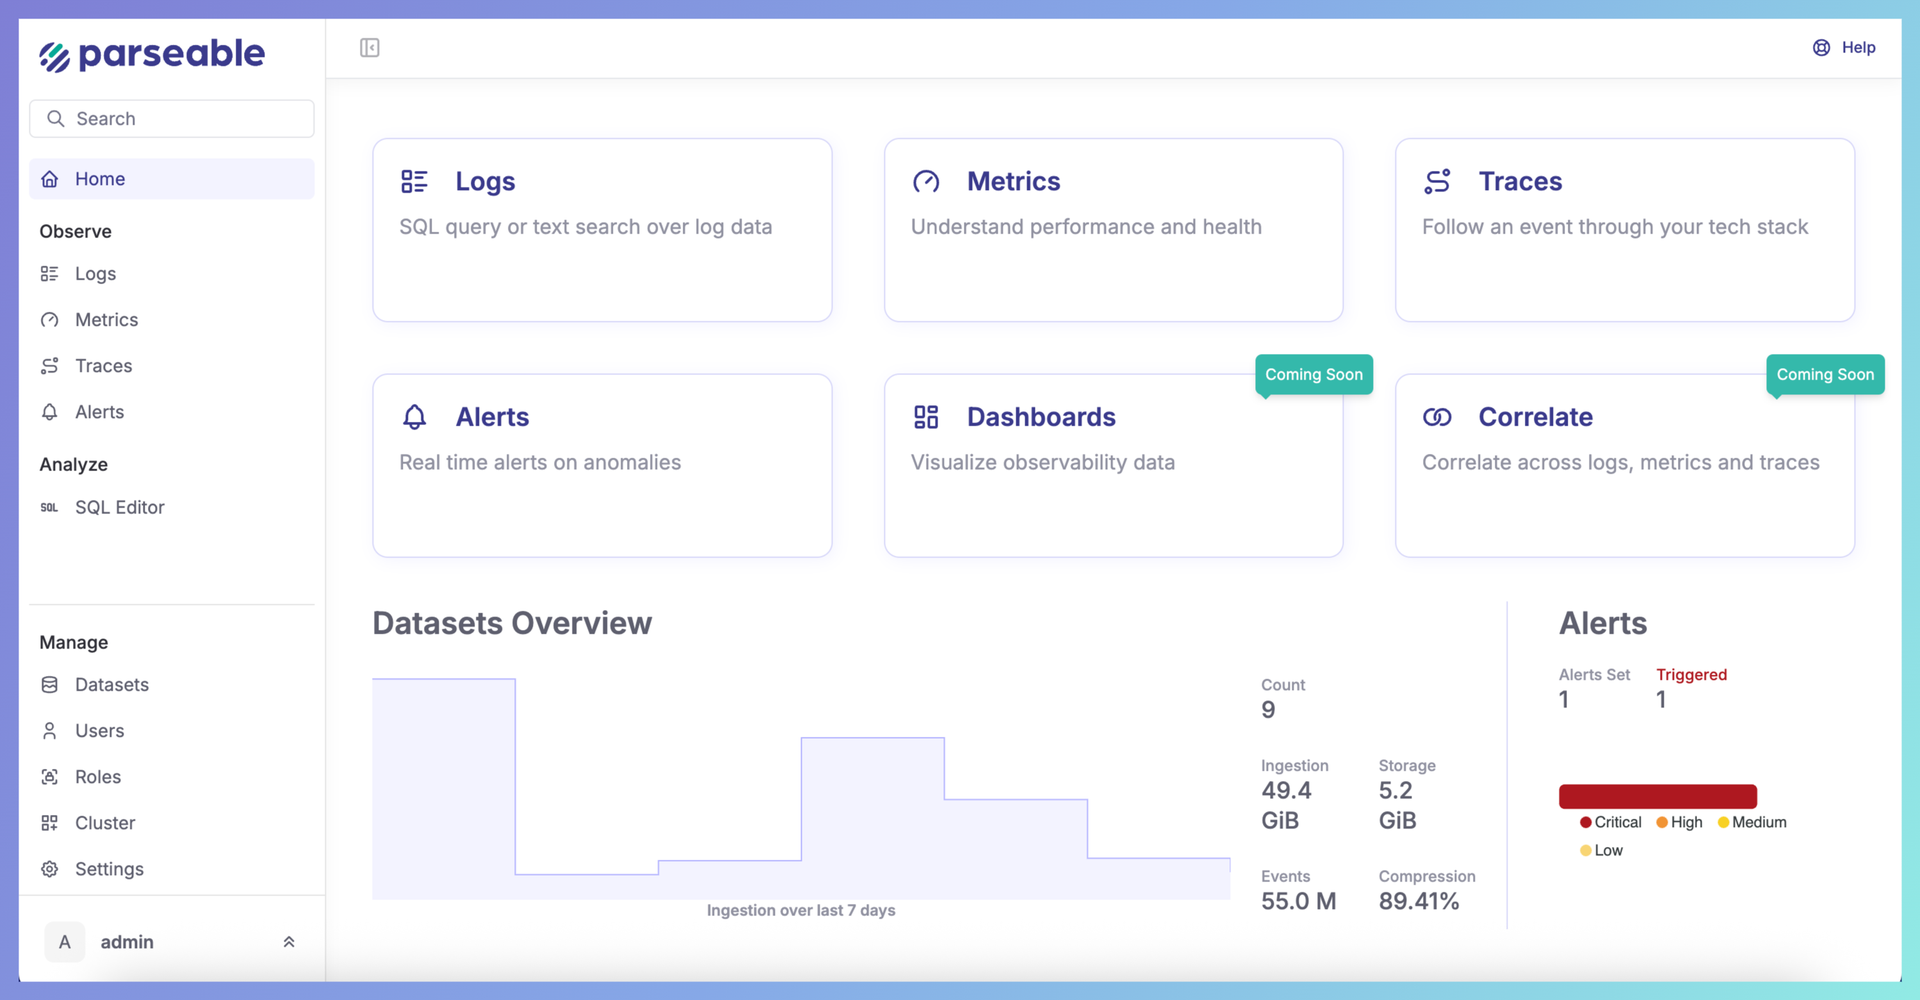
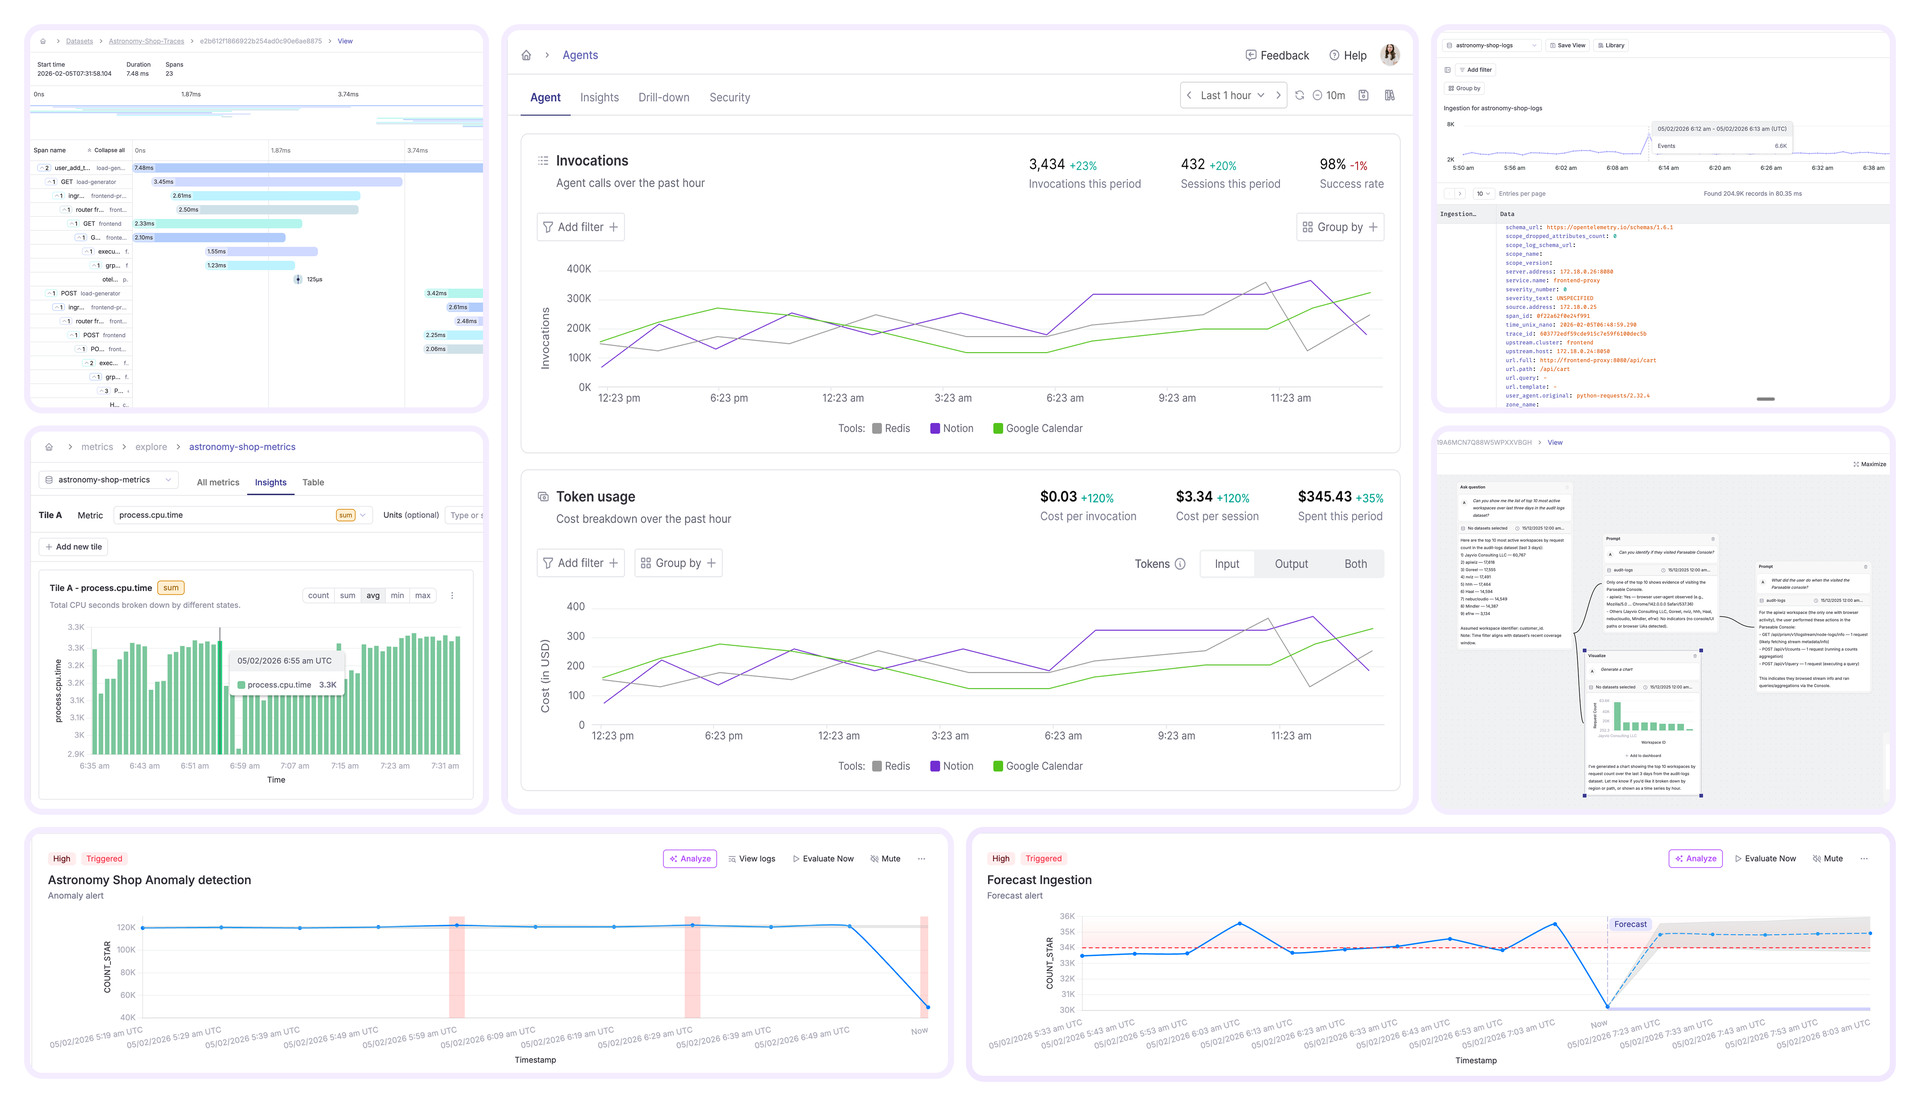
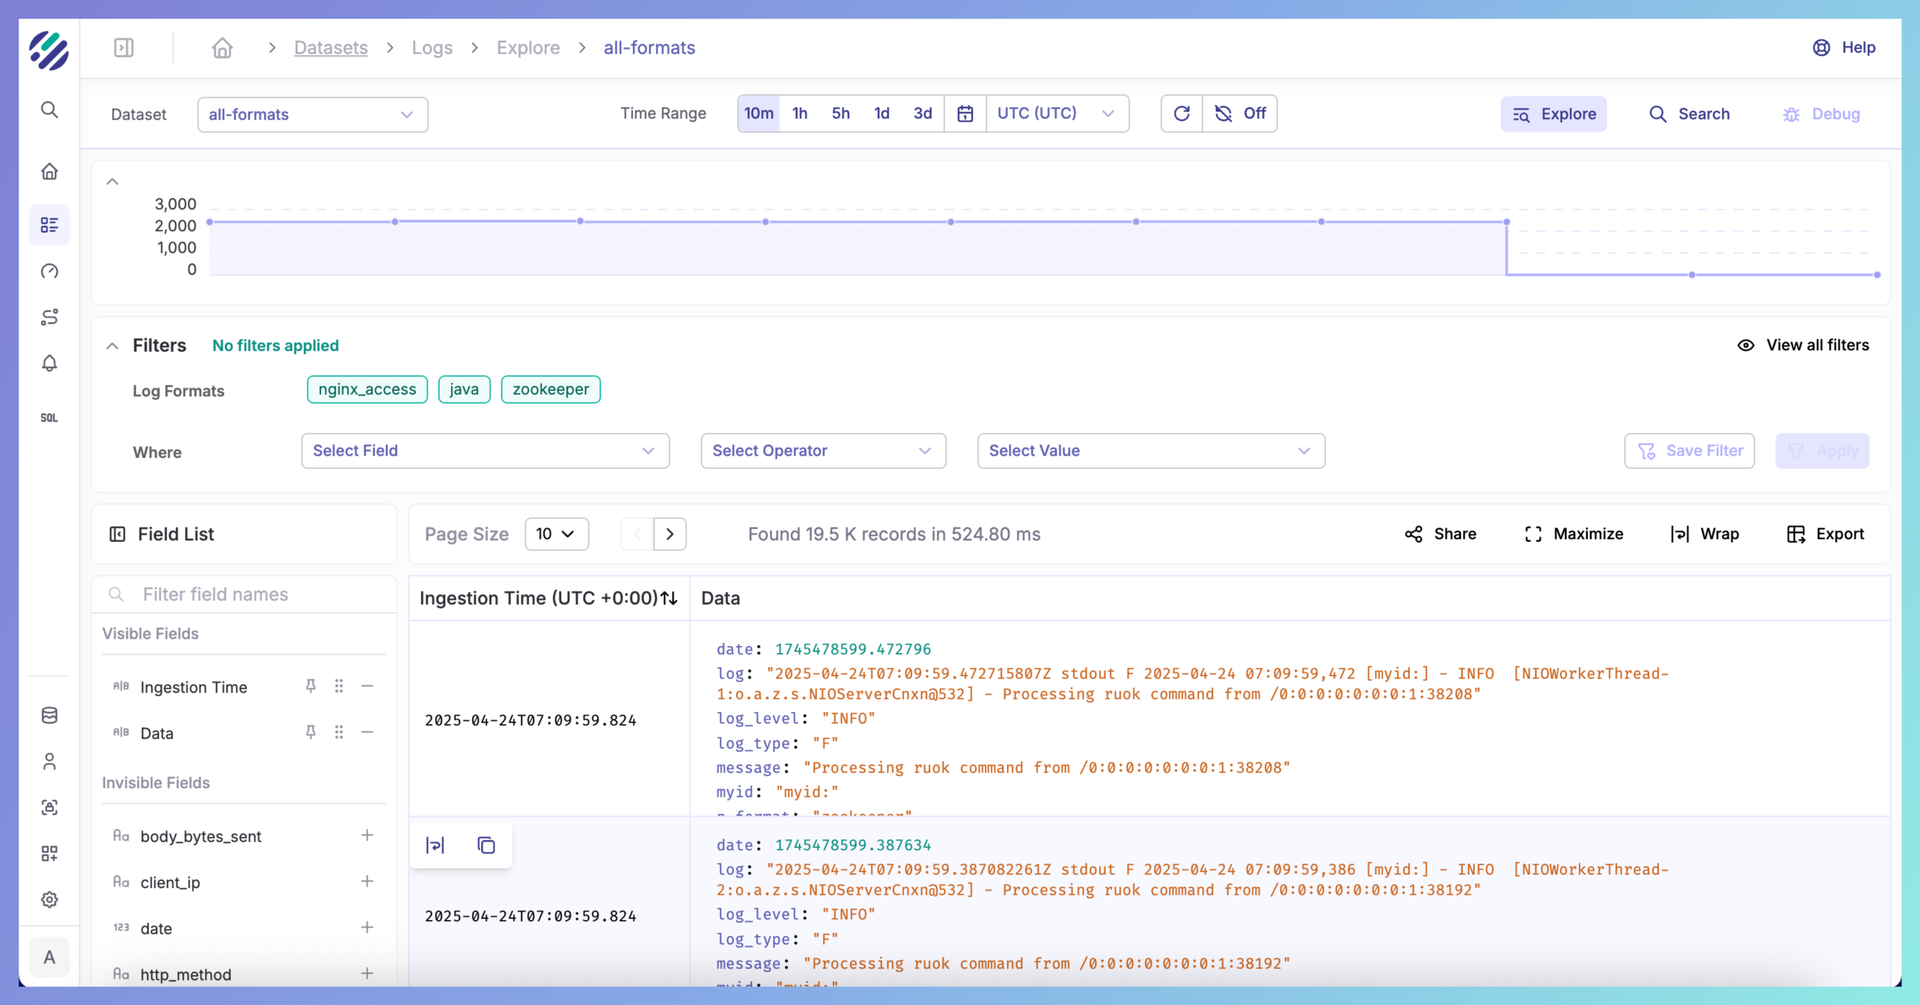
Parseable replaces expensive Elasticsearch clusters and fragmented monitoring stacks with a single Rust binary that ingests, queries, and stores logs, metrics, and traces on commodity object storage at a fraction of the cost. The data lake architecture decouples stateless compute from S3-compatible storage, enabling independent scaling of ingestion throughput and query capacity while cutting storage costs by up to 90% compared to indexed alternatives. OpenTelemetry-native OTLP ingestion accepts telemetry from existing OTel collector pipelines, Prometheus Remote Write endpoints, Kafka consumers, eBPF probes, and popular logging agents including Fluentd, Fluent Bit, and Vector without proprietary format conversions. The SQL-first query interface enables cross-signal analysis across all telemetry types, while native PromQL support with 50+ functions and 12 aggregation operators provides Prometheus-compatible metrics querying that works directly with Grafana dashboards. Built-in features include customizable dashboards, real-time alerting with Webhook, Slack, and Alertmanager targets, role-based access control, OpenID single sign-on integration, LogIQ automatic unstructured-to-structured log transformation, smart caching for frequently accessed data, and retention policies for lifecycle management. AI-powered Keystone Q&A provides natural language to SQL conversion and dataset summarization. All data stored as standard Apache Parquet on object storage remains accessible to any Parquet-compatible engine (DuckDB, Spark, Trino), ensuring zero vendor lock-in. Deploys on AWS S3, Azure Blob, Google Cloud Storage, MinIO, Wasabi, and DigitalOcean Spaces. Running on a dedicated VPS on RepoCloud with guaranteed CPU, RAM, and SSD, full root SSH access, and a browser serial console. Apache 2.0 licensed.
Benefits
- Data Lake Object Storage Architecture
- Stateless compute over S3-compatible object storage decouples ingestion from querying, enabling independent scaling while reducing storage costs by up to 90% compared to indexed Elasticsearch alternatives.
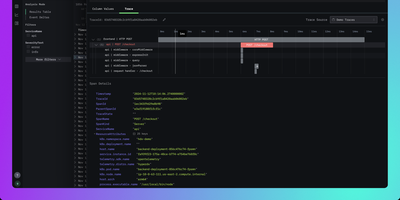
- Unified Logs Metrics and Traces
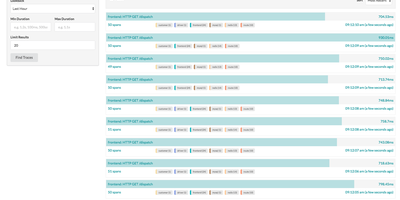
- Single platform ingests, stores, and queries all three telemetry signals using SQL across logs, metrics, and traces without requiring separate tools for each signal type.
- OpenTelemetry Native Ingestion
- OTLP endpoints accept telemetry from existing OpenTelemetry collector pipelines, Prometheus Remote Write, Kafka, eBPF, Fluentd, Fluent Bit, and Vector without proprietary agents or format conversions.
- Open Parquet Format Zero Lock-In
- All telemetry data stored as standard Apache Parquet files on object storage remains readable by any Parquet-compatible engine including DuckDB, Spark, and Trino with no proprietary format dependency.
Features
- SQL and PromQL Queries
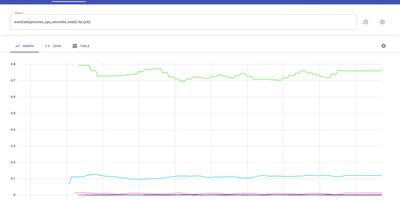
- SQL-first cross-signal analysis with native PromQL support providing 50+ functions, 12 aggregation operators, and Prometheus HTTP API compatibility for Grafana integration.
- Real-Time Alerting Engine
- Dataset-level alerts with field monitoring, conditional filters, group-by granularity, and notification delivery to Webhook, Slack, and Alertmanager targets.
- AI-Powered Keystone Q&A
- Natural language to SQL conversion, dataset summarization, and AI-assisted investigation for moving from alerts to root-cause hypotheses across telemetry signals.
- LogIQ Transformation
- Automatic conversion of unstructured log strings into structured JSON columns for improved compression, queryability, and visualization across log datasets.
- Smart Cache System
- Intelligent caching of frequently accessed Parquet data on NVMe SSDs with automatic eviction and manifest-based metadata to minimize object store API calls.