Categories
Data Visualization Dashboards Notebooks Data Analysis SQL Editor Local-First DuckDB Text-to-SQLStars
Forks
Watchers
Developer links
Duck-UI
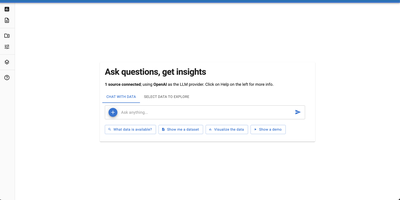
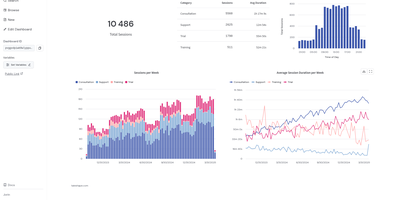
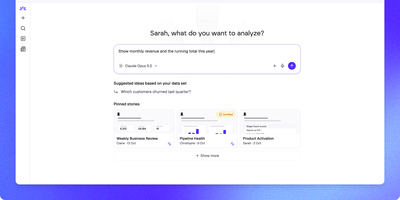
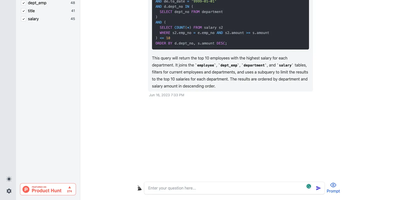
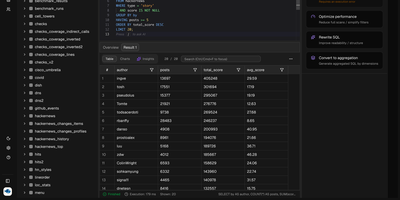
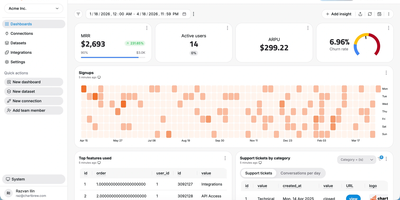
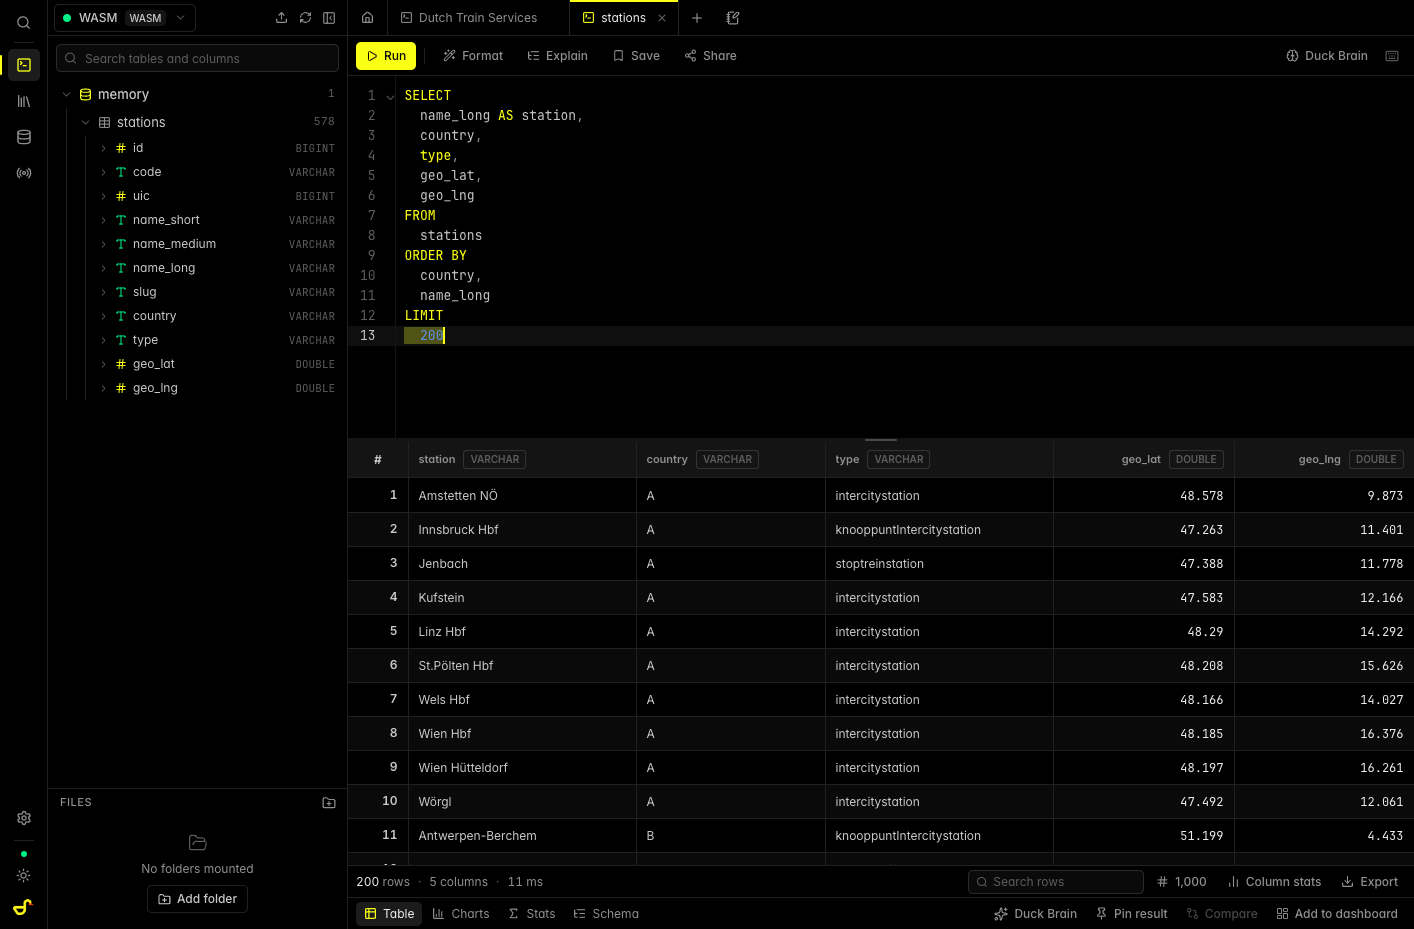
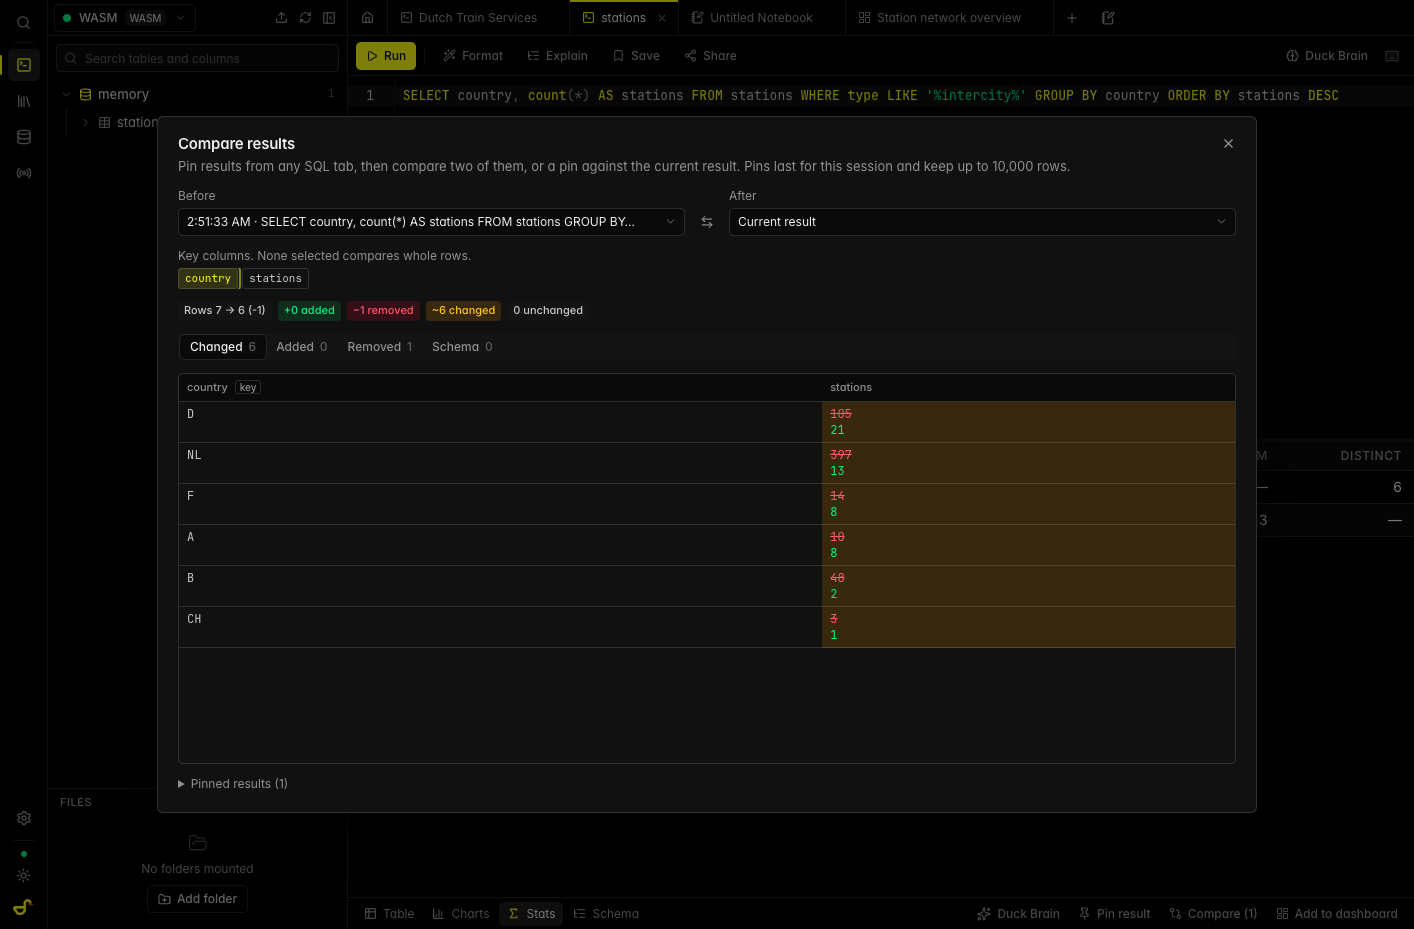
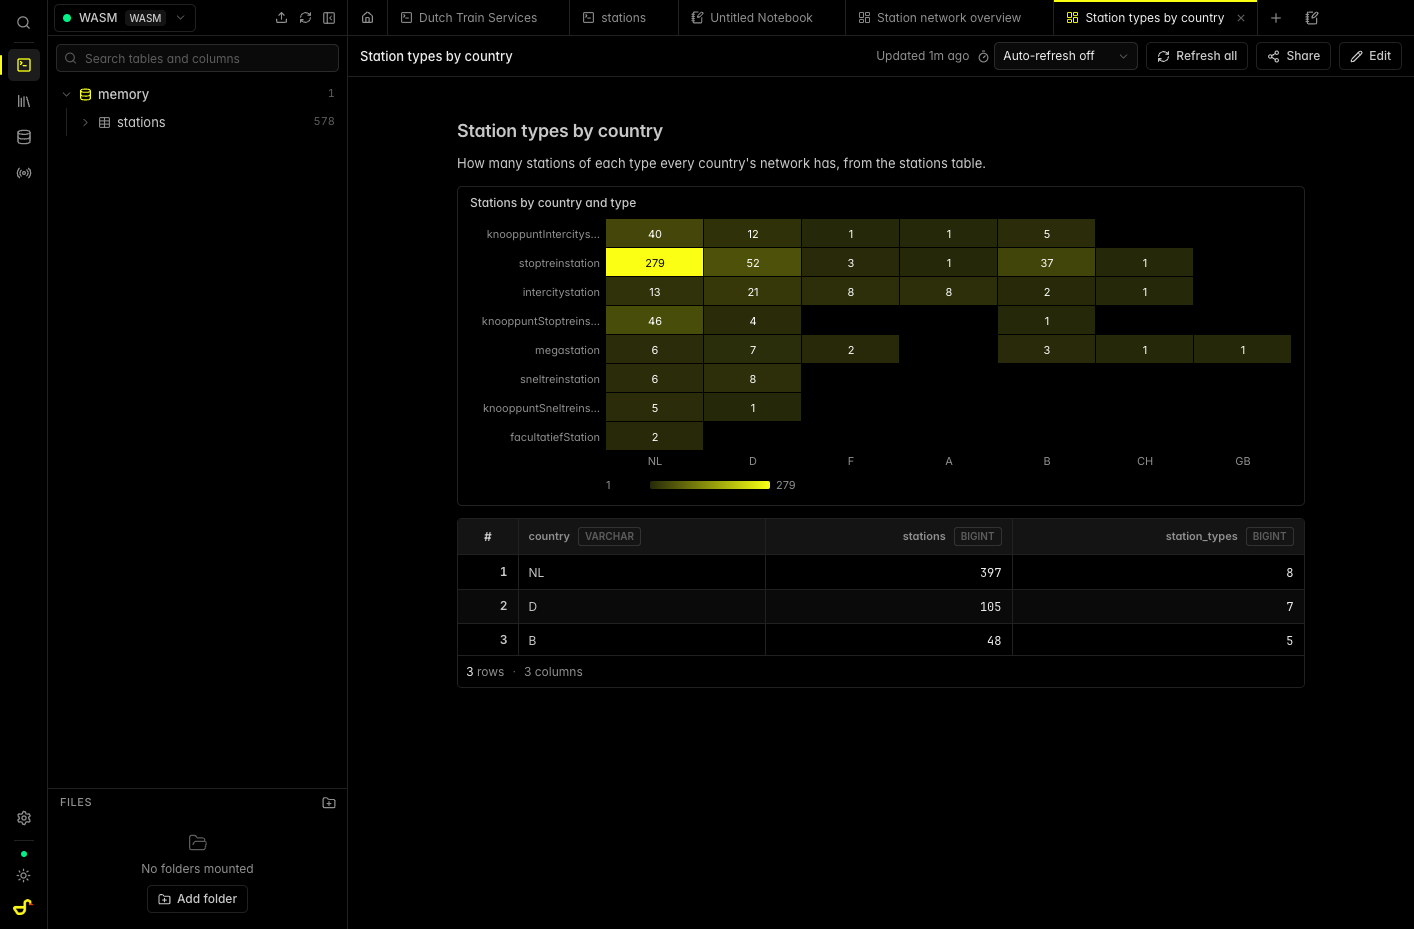
Drop a file into a browser tab and Duck-UI runs DuckDB on it with a SQL editor, notebooks, dashboards, and an AI assistant, and your data never leaves the tab. Bring in CSV, JSON, Parquet, Arrow, XLSX, or .duckdb files by dropping them or pasting a URL, or read straight from S3, GCS, Azure, R2, or MinIO. Write SQL with catalog-aware completion, see a failed query underlined where DuckDB points, then sort, filter, and export results to CSV, JSON, XLSX, or Parquet. Pin a result and diff it against a later run, or build notebooks that mix SQL, Python returning pandas DataFrames, and markdown, each cell with its own chart. Dashboards are markdown reports with named SQL blocks, charts, inputs, and auto refresh, shareable as a link, and a live runnable query can be embedded in any page. Ask Duck Brain for SQL in plain language or a one-click fix for a failed query, running on in-browser WebLLM, OpenAI, Anthropic, or an OpenAI-compatible endpoint like Ollama, with only your schema sent by default. Invite a teammate into a live session with shared editors and peer cursors, or publish a read-only dataset explorer in kiosk mode. Deploy it as one Docker image or on any static host, air-gapped setups included. Running on a dedicated VPS on RepoCloud with guaranteed CPU, RAM, and SSD, full root SSH access, and a browser serial console. MIT licensed.
Benefits
- Your Data Stays in the Tab
- DuckDB runs inside each visitor's browser, so files, queries, and results are processed on the device and never uploaded; saved work stays in local browser storage and credentials are encrypted there.
- One Container, No Database Server
- A single Docker image serves the whole workbench on port 5522 and DuckDB executes in the browser, so there is no database server, no application backend, and no accounts to manage.
- From Plain Question to Chart
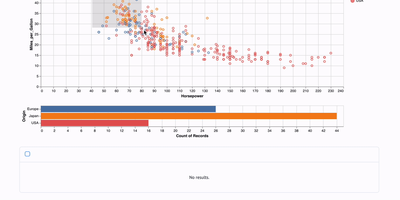
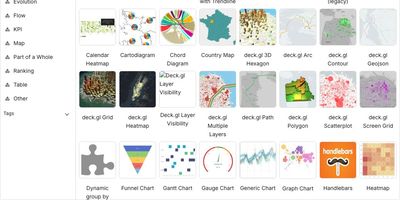
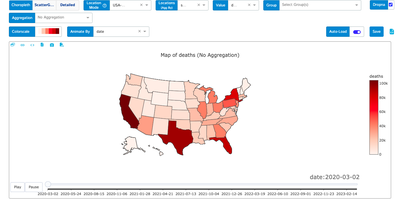
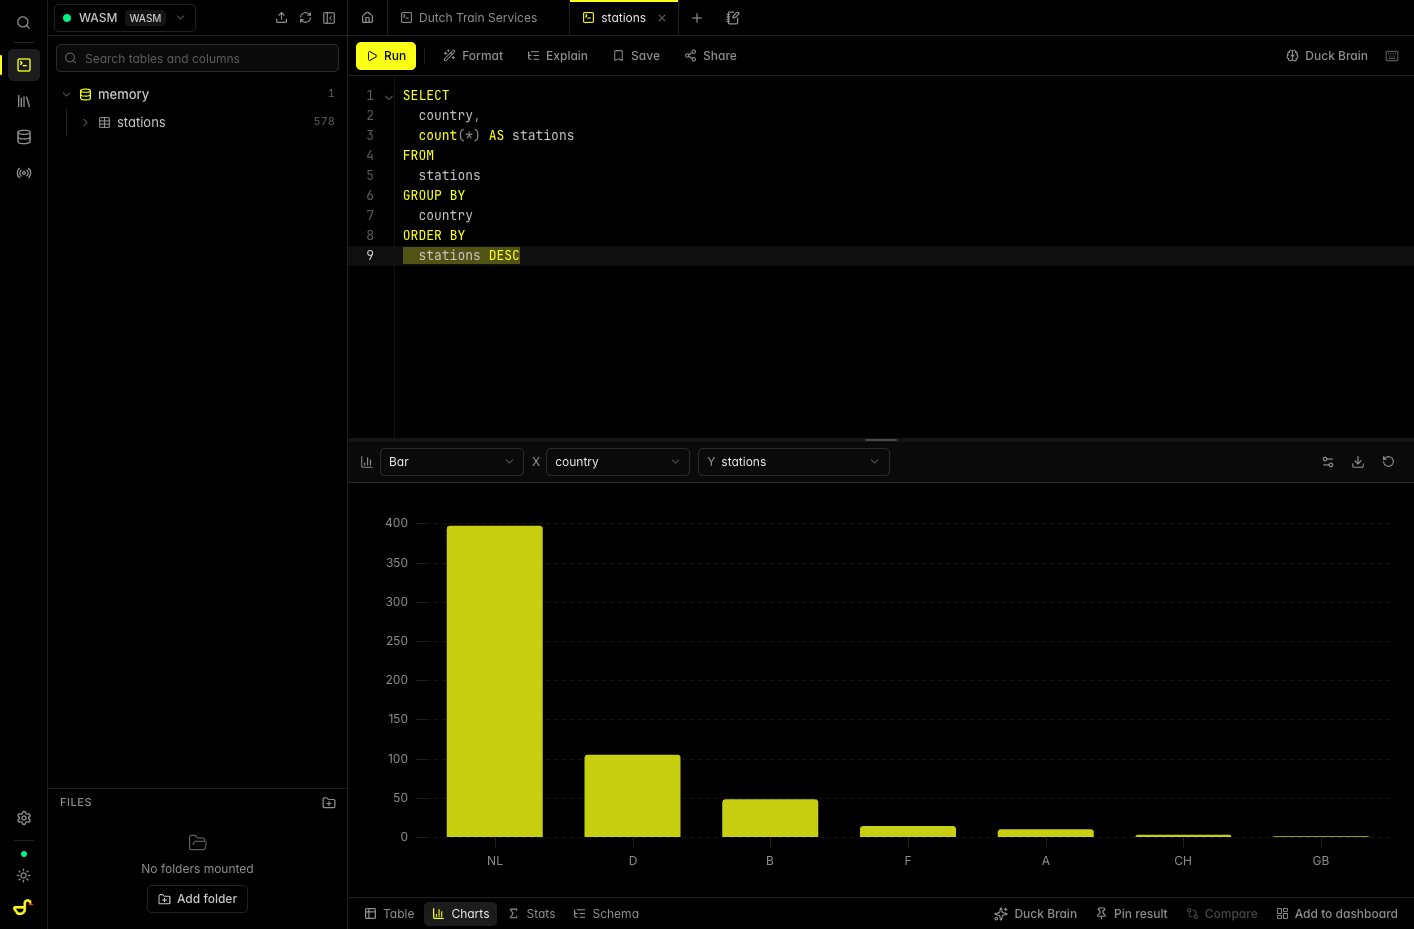
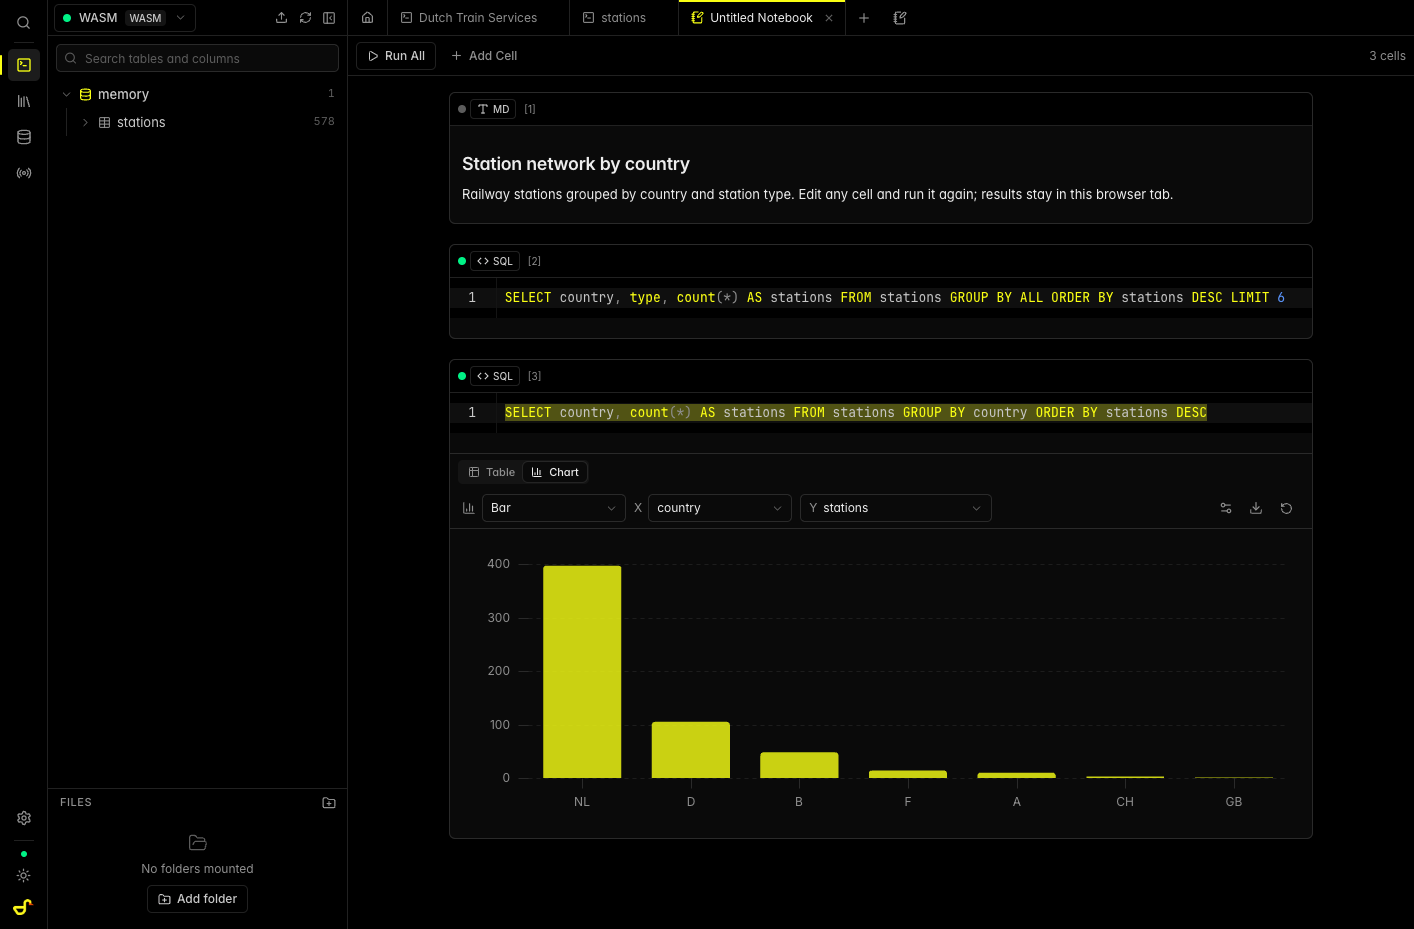
- Ask Duck Brain in plain language, run the generated SQL, then switch the result to a bar, line, area, pie, donut, or scatter chart without leaving the tab.
- Share Analyses Without Sharing Data
- Encode a query, notebook, or dashboard into a link that carries source but never results, embed a runnable chart by iframe, or co-edit live while the host picks what data guests can query.
Features
- SQL Editor and Results Grid
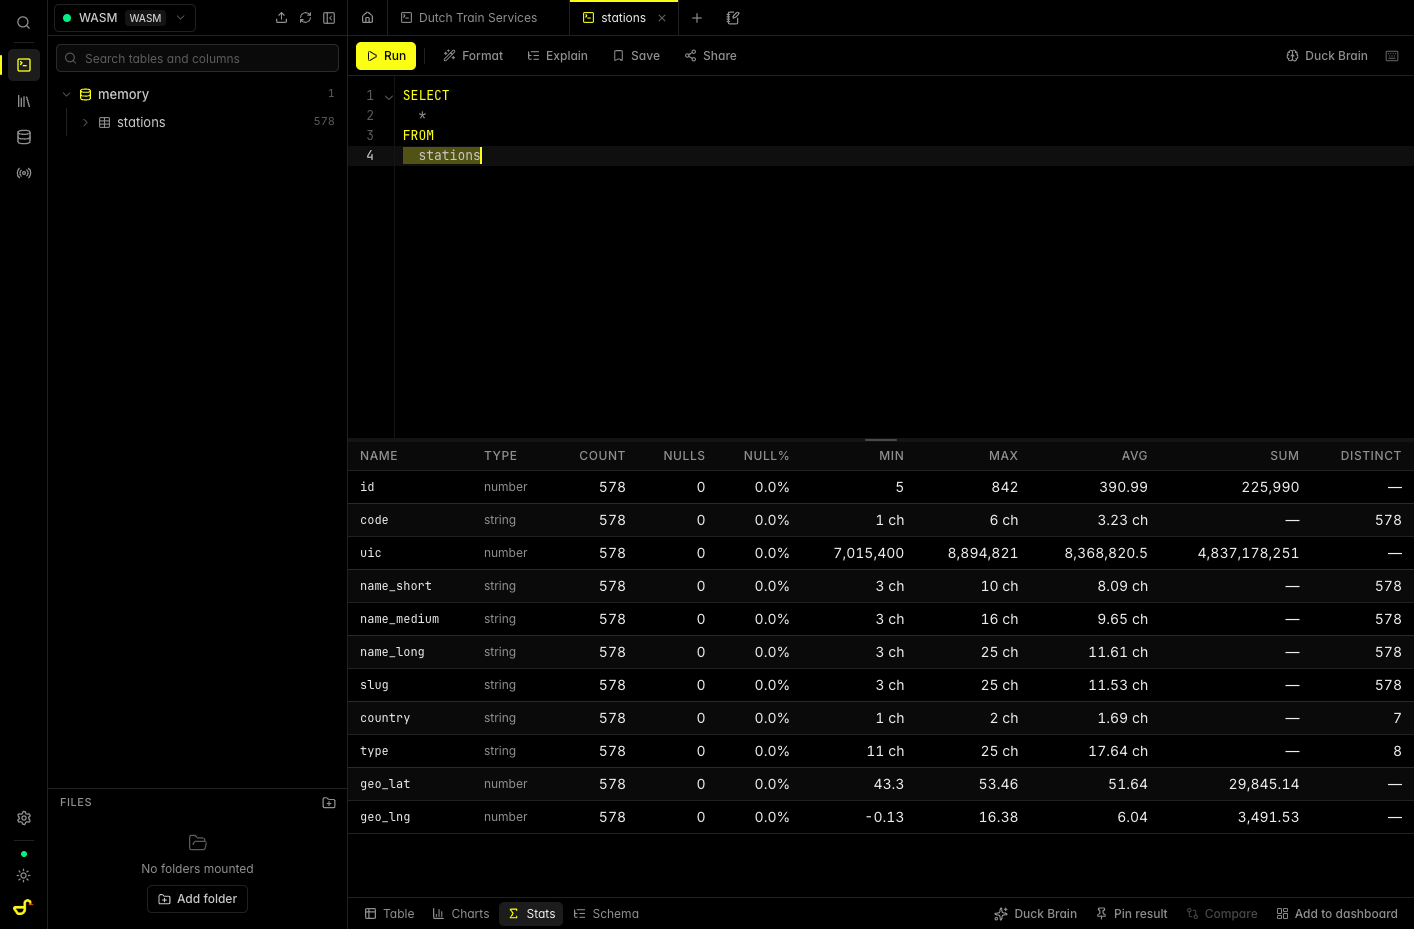
- CodeMirror editor with catalog-aware completion, DuckDB dialect formatting, and an EXPLAIN ANALYZE viewer, above a virtualized grid with column stats and CSV, JSON, XLSX, and Parquet export.
- SQL and Python Notebooks
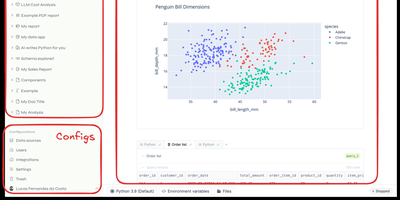
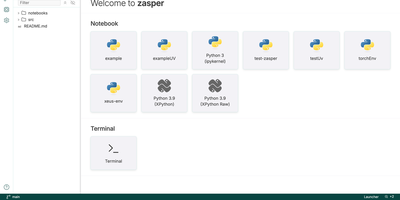
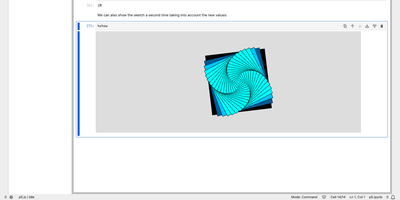
- Notebook cells hold SQL, markdown, and Python run by Pyodide, where sql() returns a pandas DataFrame, and every cell keeps its own result and chart.
- Markdown Dashboards
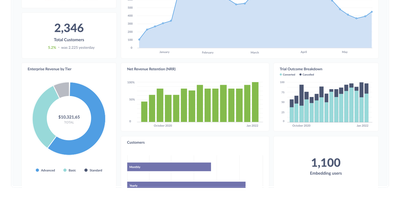
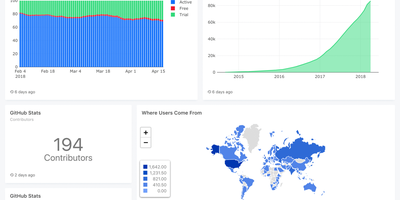
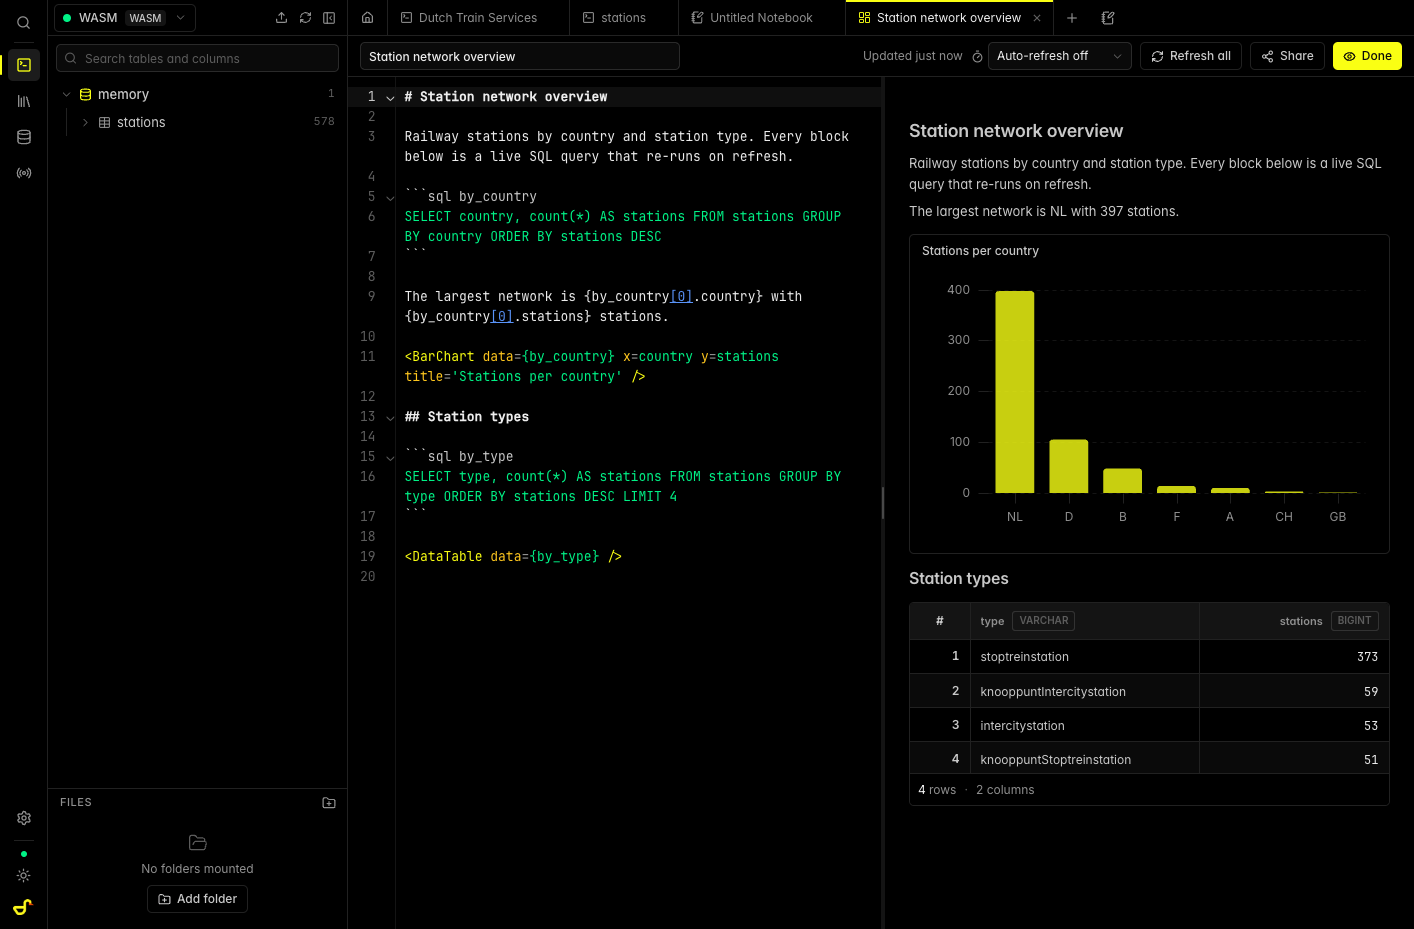
- Reports written as markdown with named SQL blocks, charts, tables, dropdown and date inputs, and auto refresh from 30 seconds to one hour, shareable by link.
- Duck Brain Text-to-SQL
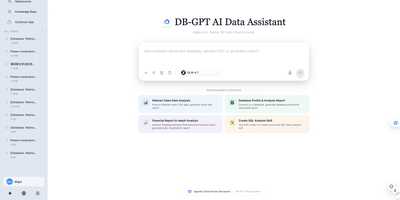
- Plain-language questions become SQL, failed queries get suggested fixes, and results can be explained, through Ollama, LM Studio, OpenAI-compatible endpoints, OpenAI, Anthropic, or a WebLLM model in the tab.
- Live Sessions and Embeds
- Peer-to-peer WebRTC sessions give guests shared editors and visible cursors with no server in between, and an iframe embeds a runnable query in any page.
- Remote DuckDB and Cloud Files
- Attach a remote DuckDB server over Quack or the httpserver extension and join its tables with local files in one query, or read S3, GCS, Azure, R2, or MinIO.