Categories
Observability Data Visualization Business Intelligence Data Exploration Analytics Dashboard Log Analytics Search AnalyticsStars
Forks
Watchers
Developer links
OpenSearch Dashboards
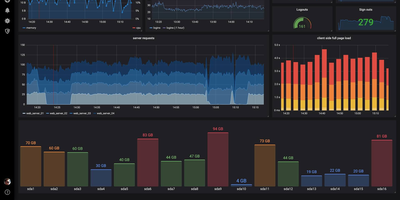
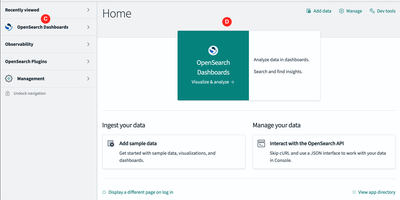
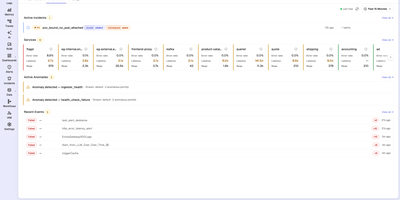
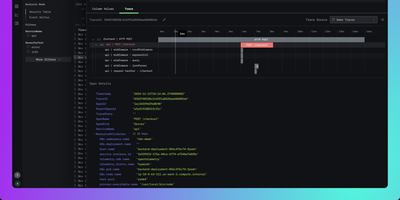
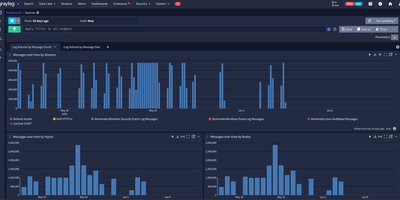
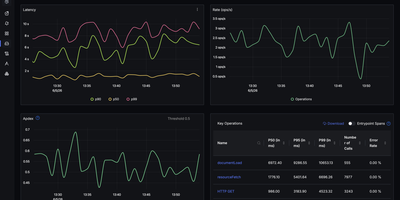
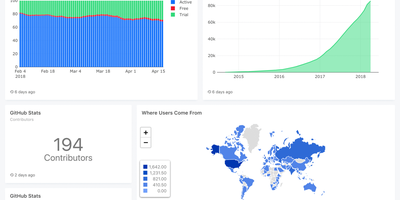
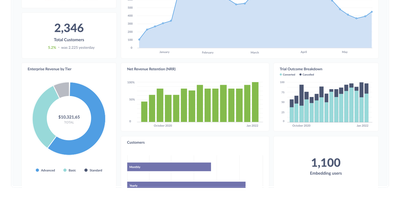
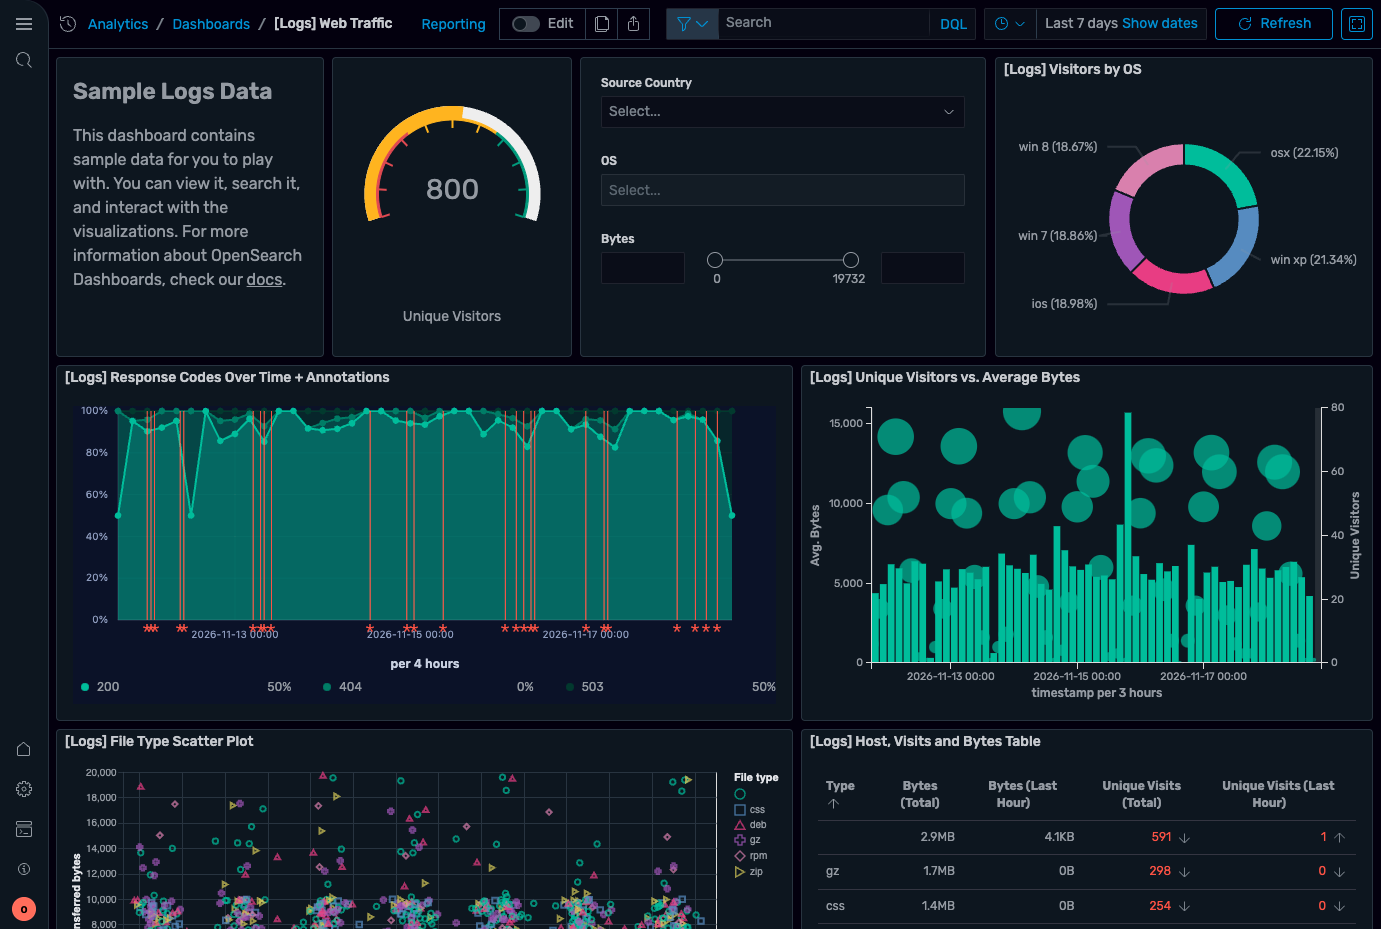
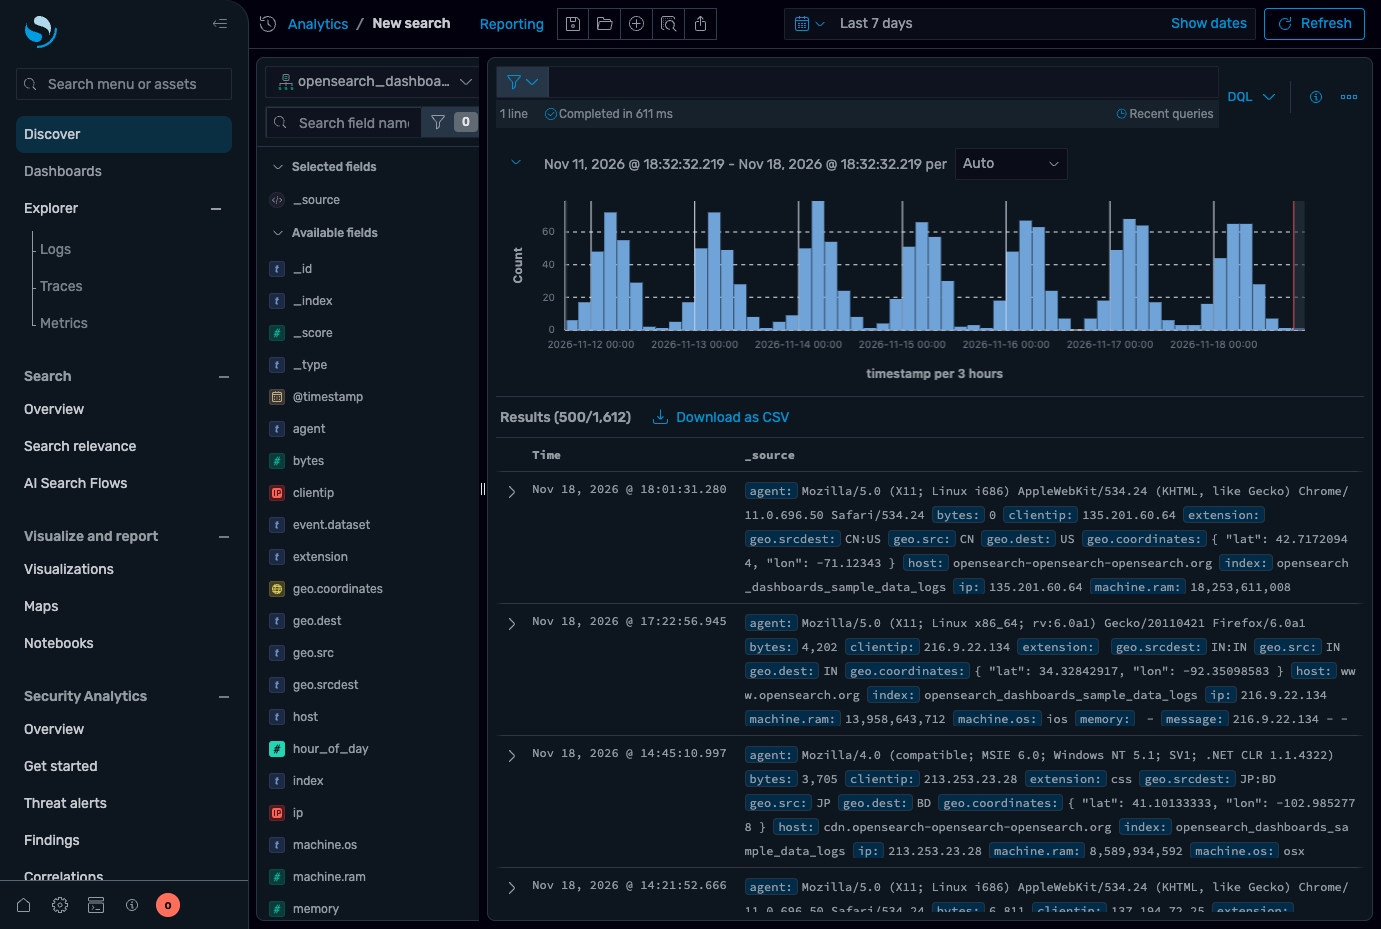
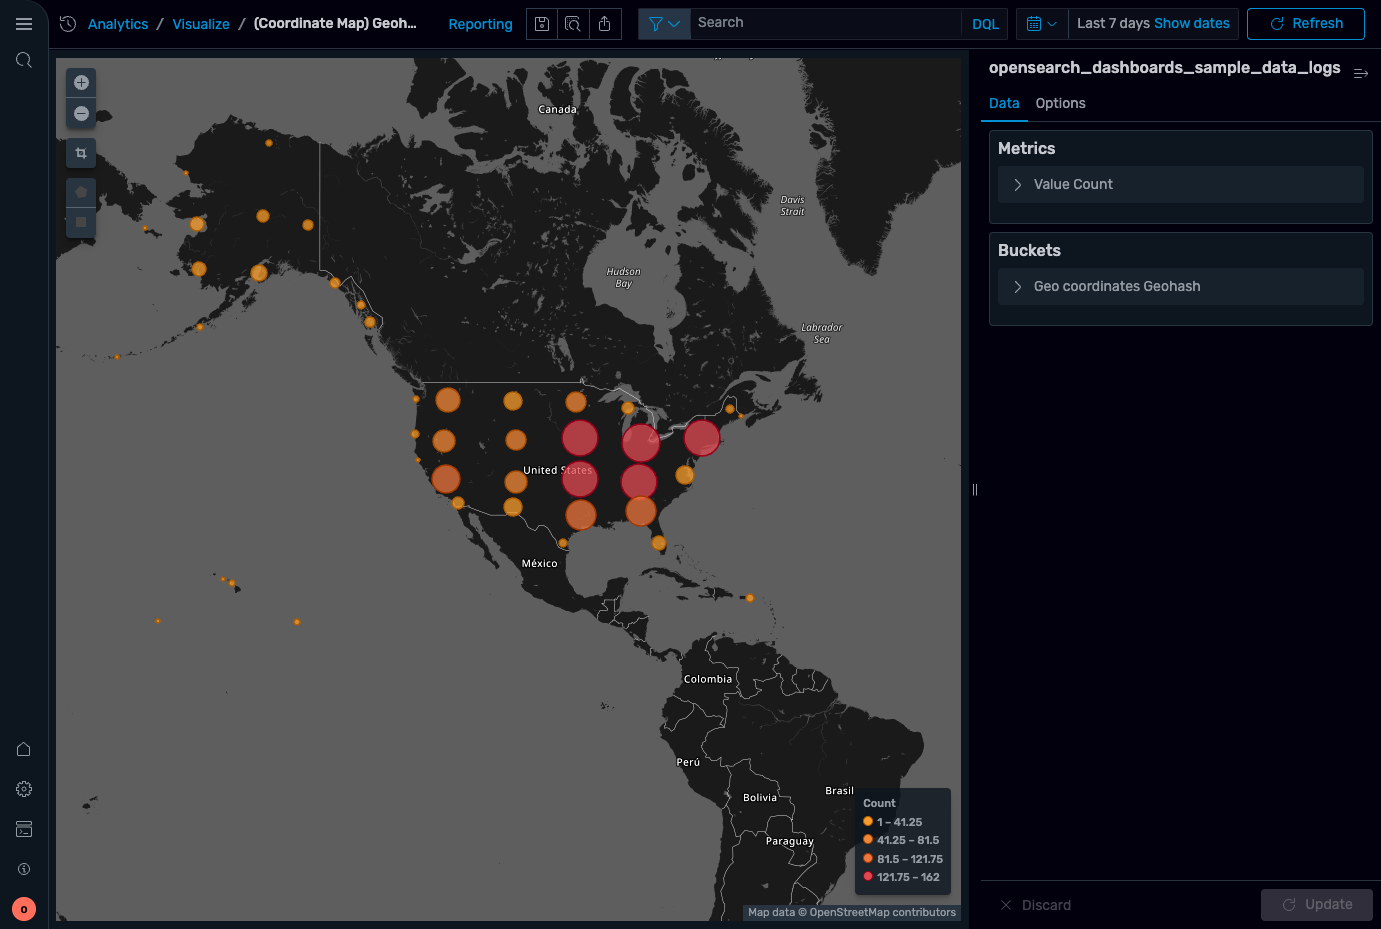
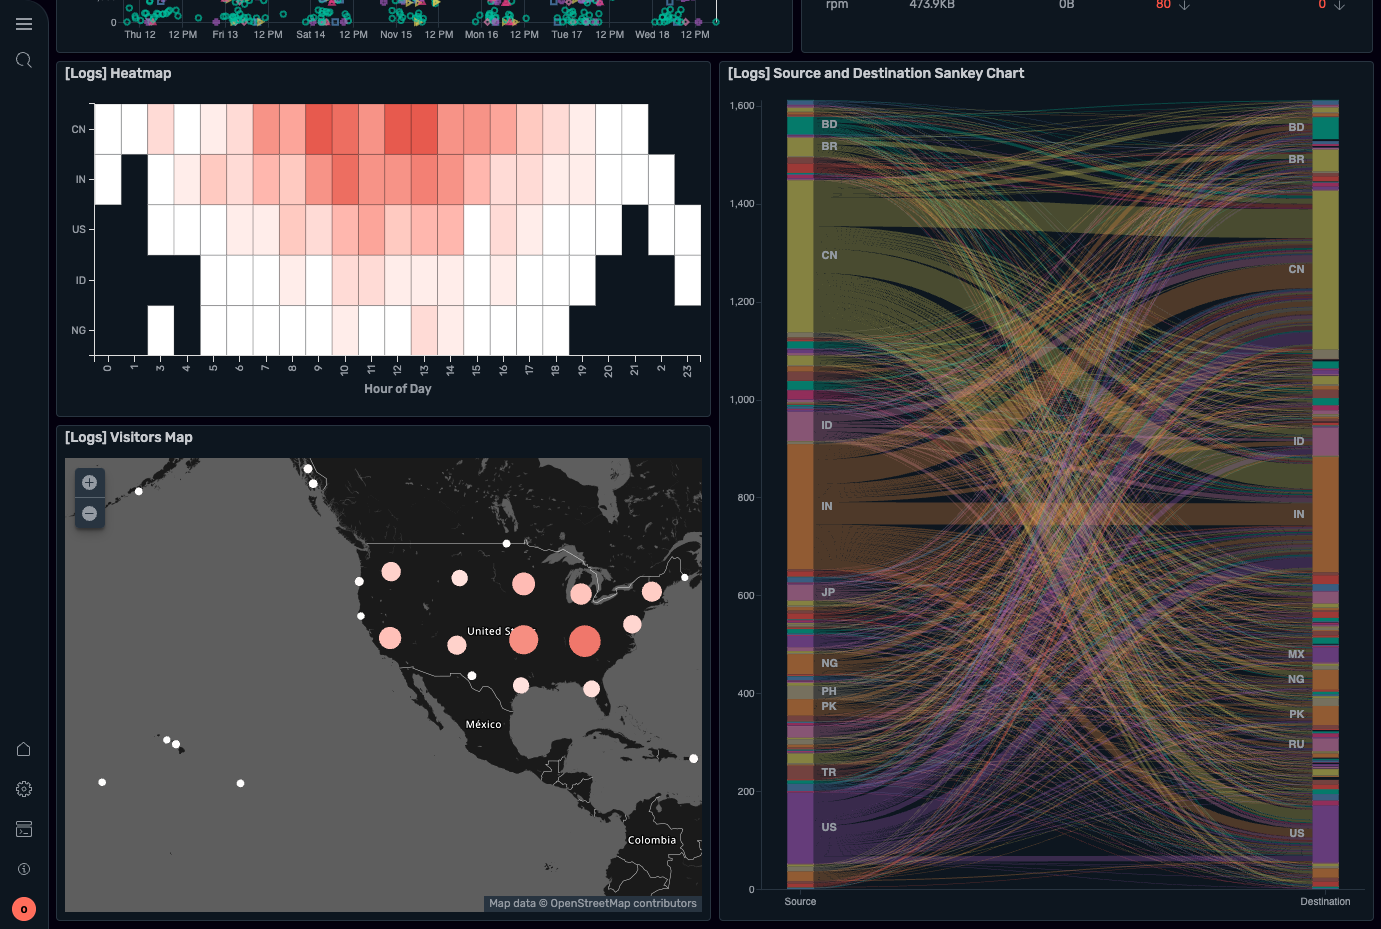
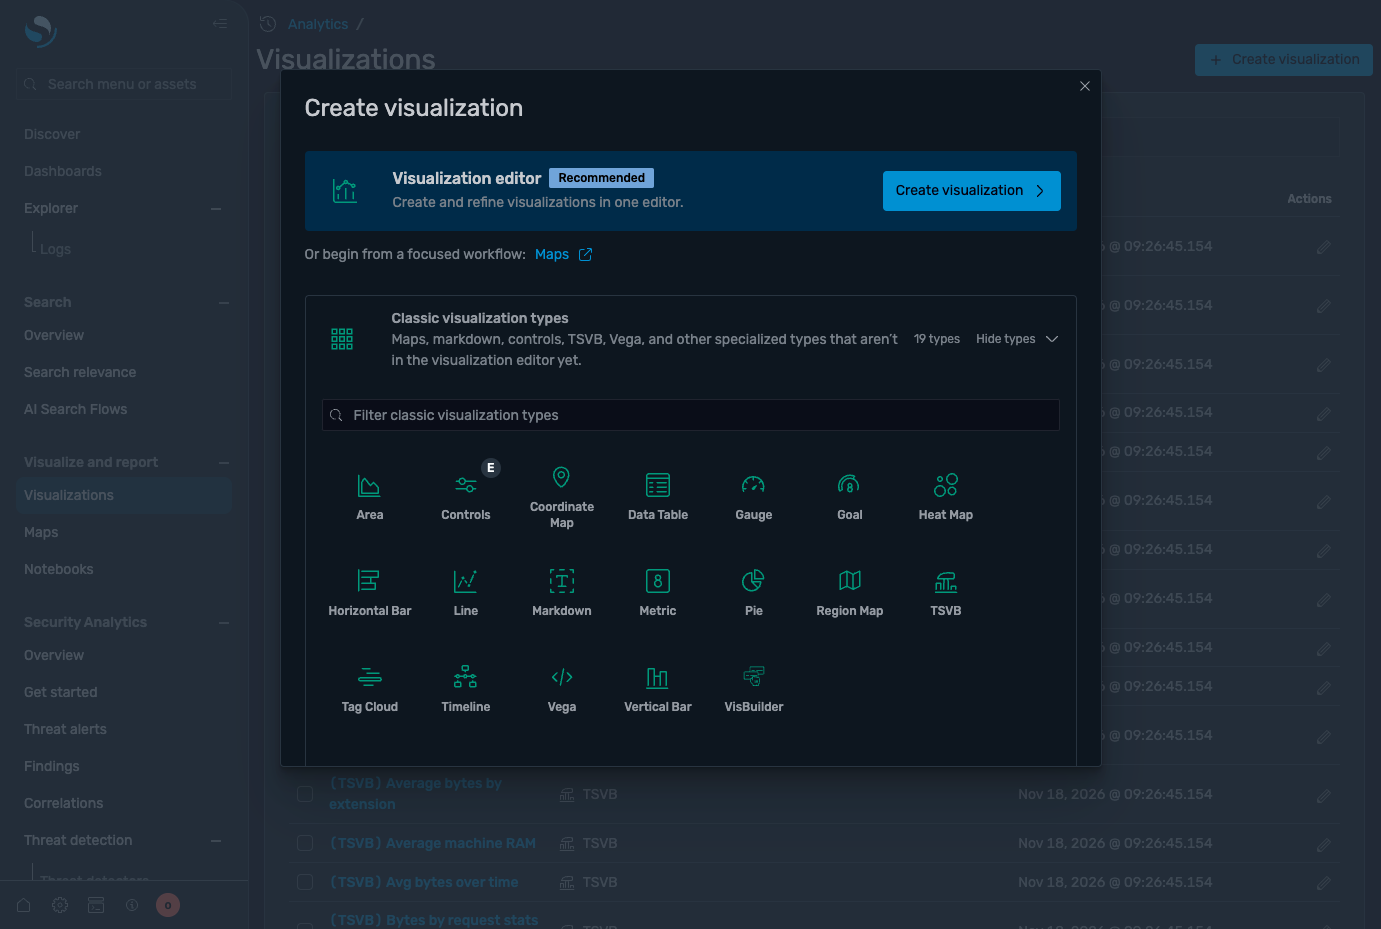
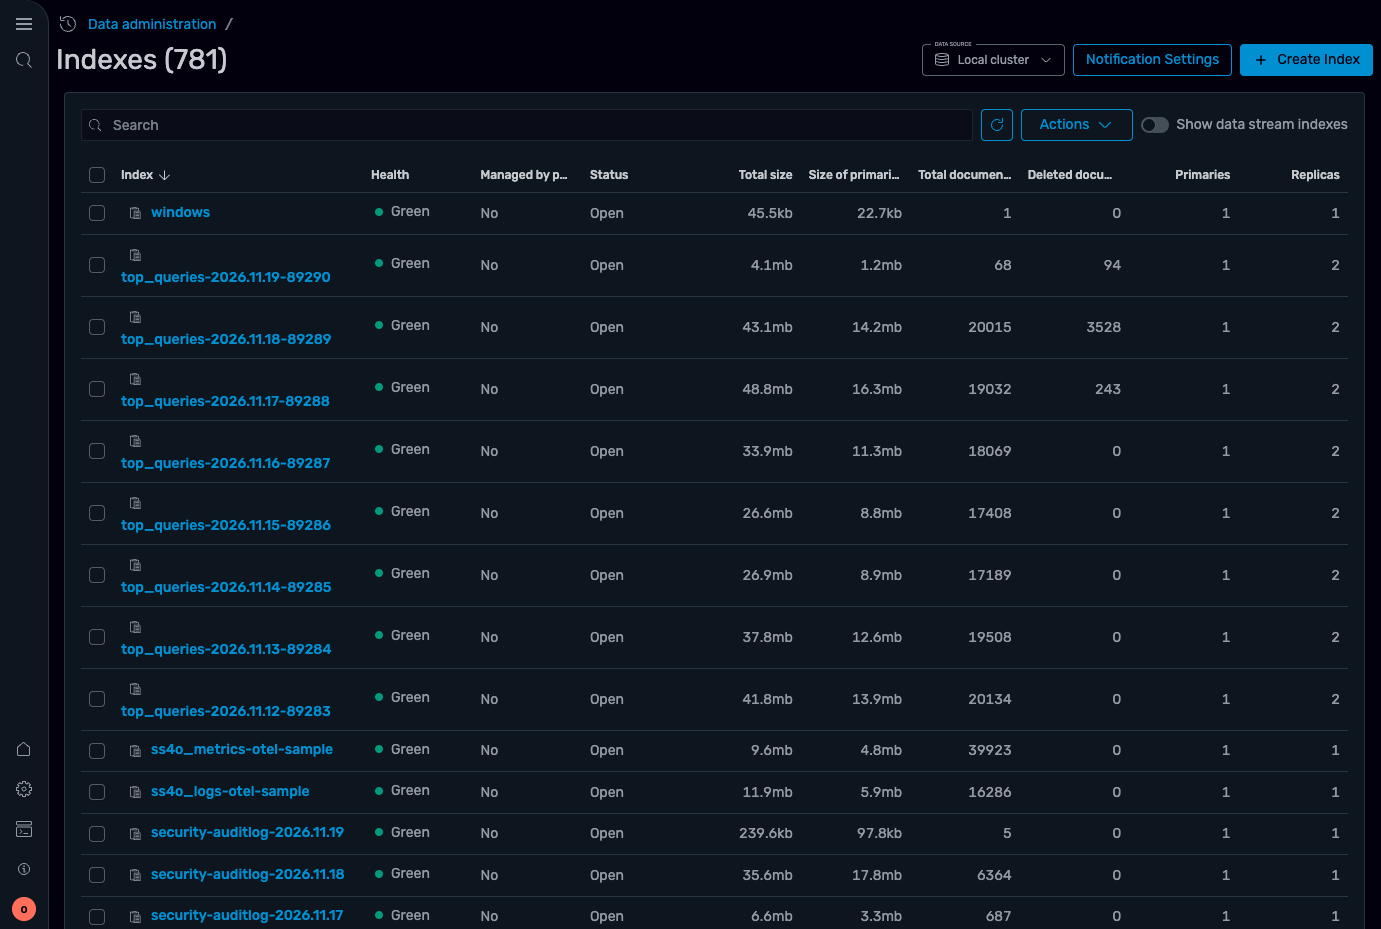
Point OpenSearch Dashboards at an OpenSearch cluster and the documents inside become searchable tables, charts, maps, and dashboards in a browser, with no API requests to write. Discover shows a histogram of documents over time. A field list sits beside expandable results. DQL or Lucene query strings narrow them, and the rows export as CSV. Visualize builds area, bar, line, pie, heat map, gauge, tag cloud, and map charts in a point-and-click editor. TSVB, Timeline, and Vega cover advanced cases. Dashboards combine those panels with input controls, a time picker, and a query bar that filters every panel at once. Sample data brings ready-made logs, flights, and eCommerce dashboards. Query Workbench runs SQL and PPL. Dev Tools sends Query DSL requests. Index Management lists indexes with health, size, and document counts. Reporting exports dashboards and visualizations as PDF, PNG, CSV, or XLSX, once or on a schedule. Observability apps explore logs, traces, and metrics. Alerting monitors and Anomaly Detection flag problems, and Notifications channels reach Slack, email, and webhooks. Data sources connect other OpenSearch clusters, Amazon S3, or Prometheus. Dashboards Management holds index patterns, saved objects, and advanced settings. Security Analytics adds threat alerts, findings, and correlations. Running on a dedicated VPS on RepoCloud with guaranteed CPU, RAM, and SSD, full root SSH access, and a browser serial console. Apache-2.0 licensed.
Benefits
- Search And Filter Any Index
- Discover pairs a time histogram and field list with DQL and Lucene queries, so analysts filter documents, expand any record, and download results as CSV.
- Build Dashboards From Many Charts
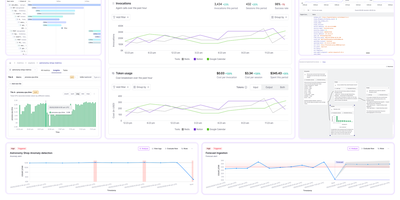
- A point-and-click editor builds area, line, pie, heat map, gauge, map, TSVB, Timeline, and Vega charts, and dashboard controls with a shared time range filter every panel together.
- Query With SQL, PPL, Or DSL
- Query Workbench runs SQL and PPL, Dev Tools sends Query DSL requests, and the search bar accepts DQL or Lucene syntax, so each person works in the language they know.
- Monitor And Share Findings
- Alerting monitors, anomaly detection, and notification channels flag problems, and Reporting exports dashboards as PDF, PNG, CSV, or XLSX files on a schedule or on demand.
Features
- Discover Search Interface
- A time histogram, field list, expandable documents, DQL and Lucene query bars, saved searches, and CSV download make up the Discover application.
- Visualization Editor
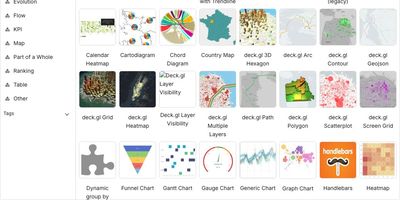
- The Visualize application builds area, bar, line, pie, gauge, heat map, tag cloud, coordinate map, region map, TSVB, Timeline, and Vega charts, with VisBuilder alongside.
- Dashboards And Controls
- Dashboards combine panels with input controls, a time picker, and a query bar, and sample data adds ready-made logs, flights, and eCommerce dashboards.
- Query Workbench And Dev Tools
- Query Workbench runs SQL and PPL, and the Dev Tools console sends OpenSearch API requests in Query DSL, with Grok Debugger and Query Profiler tabs beside them.
- Index And Snapshot Management
- Index Management lists indexes with health, size, and document counts and covers data streams, aliases, templates, and policies, and Snapshot Management backs up and restores clusters.
- Observability And Alerting
- Logs, traces, and metrics apps, Integrations with prebuilt dashboards, Alerting monitors, Anomaly Detection, and Notifications channels for Slack, email, and webhooks cover monitoring workflows.