Rath
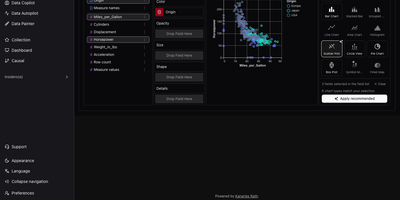
RATH, an automated data exploration workbench, turns any table into a gallery of charts worth reading, without building each chart by hand. Start with a CSV, JSON, or Excel file, or pull tables from MySQL, PostgreSQL, Oracle, SQL Server, SQLite, or Airtable. Eight built-in demo datasets are ready to try. Next comes a profile: every field gets a distribution chart and summary statistics. A metadata view retags fields as dimensions or measures. Data Autopilot then searches the dataset and pages through generated insight charts. Charts can be starred, exported, or opened in the editor. Starting from a single field, Data Copilot lists associated patterns to follow, with controls to add variables, filters, and computations. For hands-on work, the drag-and-drop chart builder offers fifteen chart types, including heat maps, box plots, and maps, plus a button that applies the recommended chart. With Data Painter, you brush points into up to ten labeled color groups or erase anomalies, then search for a chart that explains the painting. Causal analysis runs one of ten discovery algorithms, including PC, FCI, GES, and GRaSP. It then draws a directed graph with influence percentages, plus charts and statistics for any field you select. Dashboards combine titles, text, and charts in movable, resizable cards with four themes and global filters. Running on a dedicated VPS on RepoCloud with guaranteed CPU, RAM, and SSD, full root SSH access, and a browser serial console. AGPL-3.0 licensed.
Deploy