Categories
Self-Hosted DevOps Monitoring Alerting Incident Management Status Page Uptime Monitoring On-CallStars
Forks
Watchers
Developer links
uptimepage
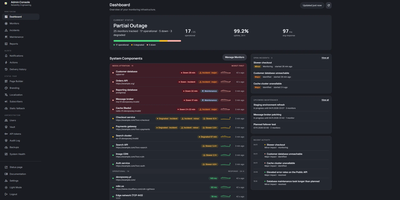
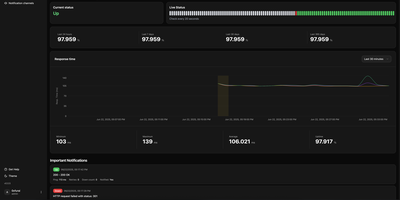
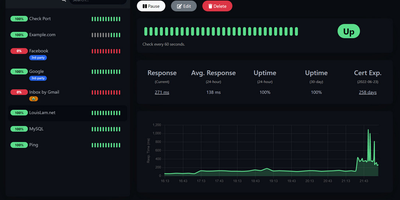
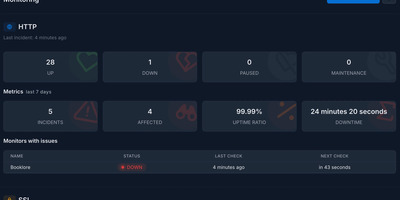
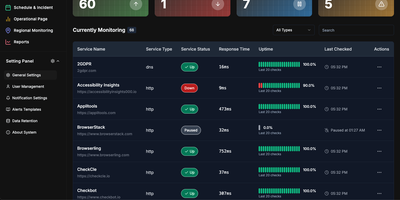
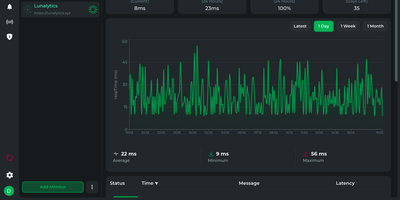
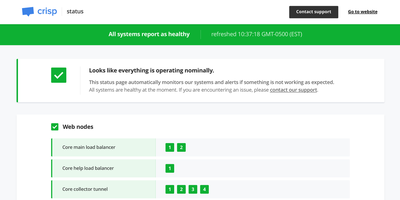
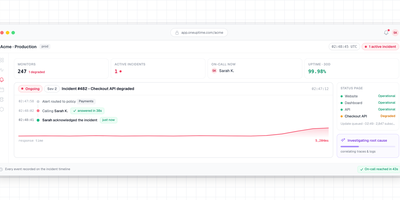
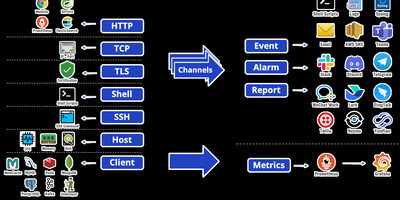
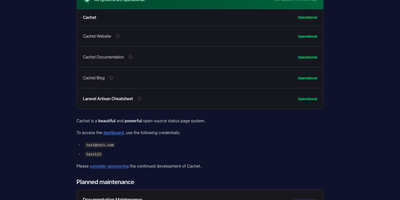
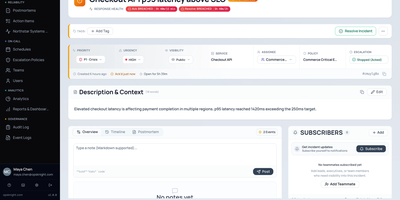
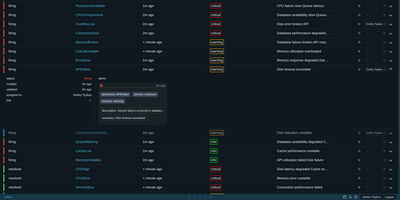
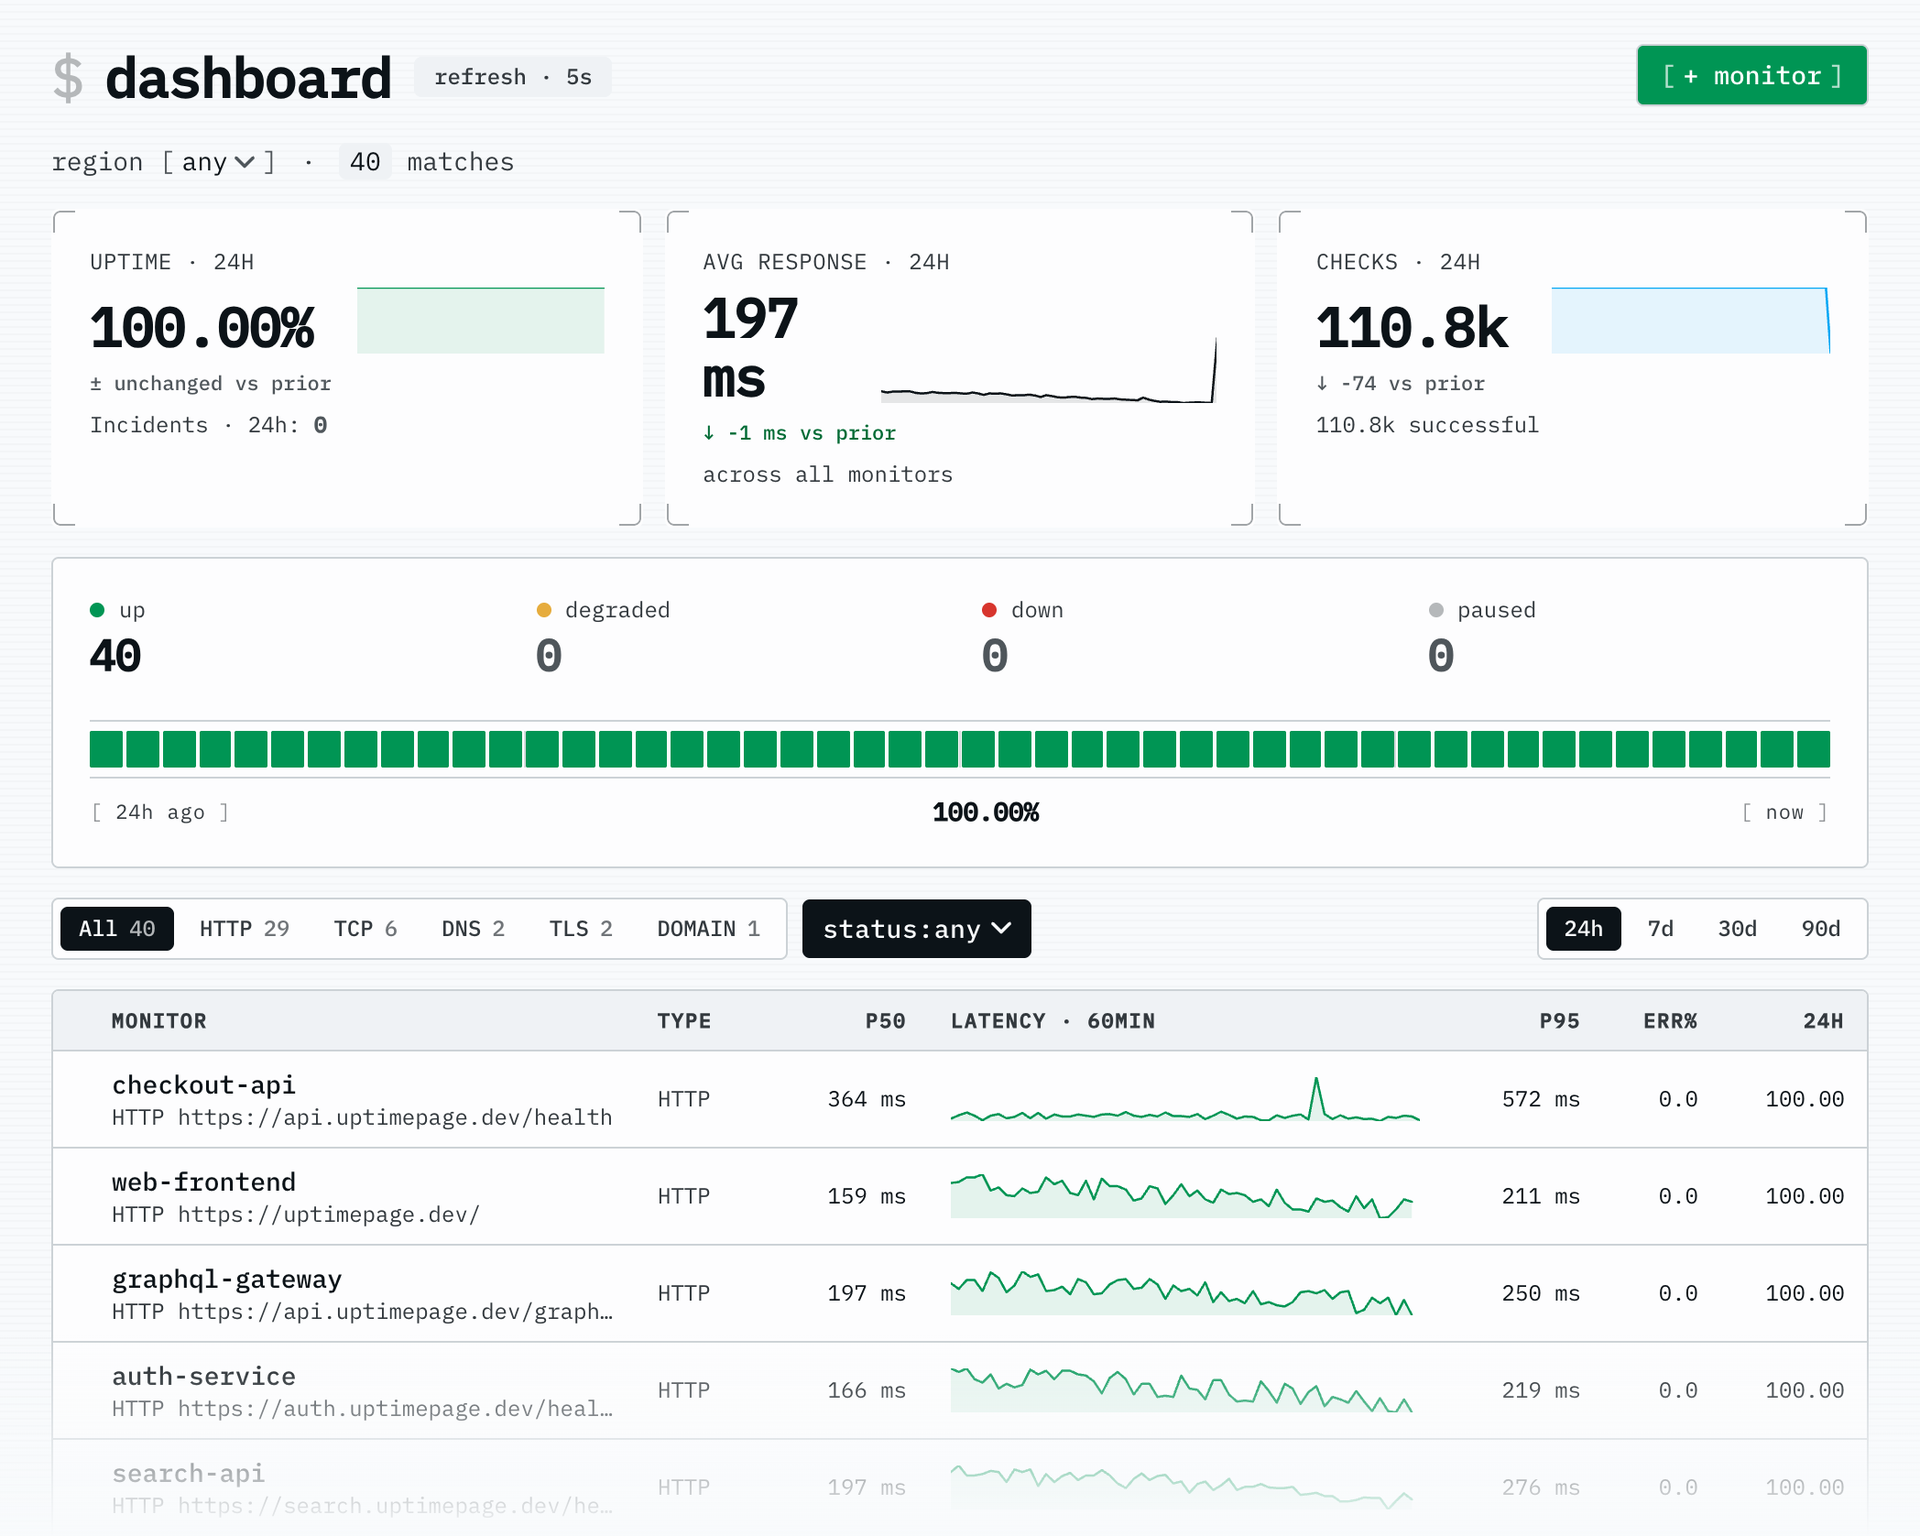
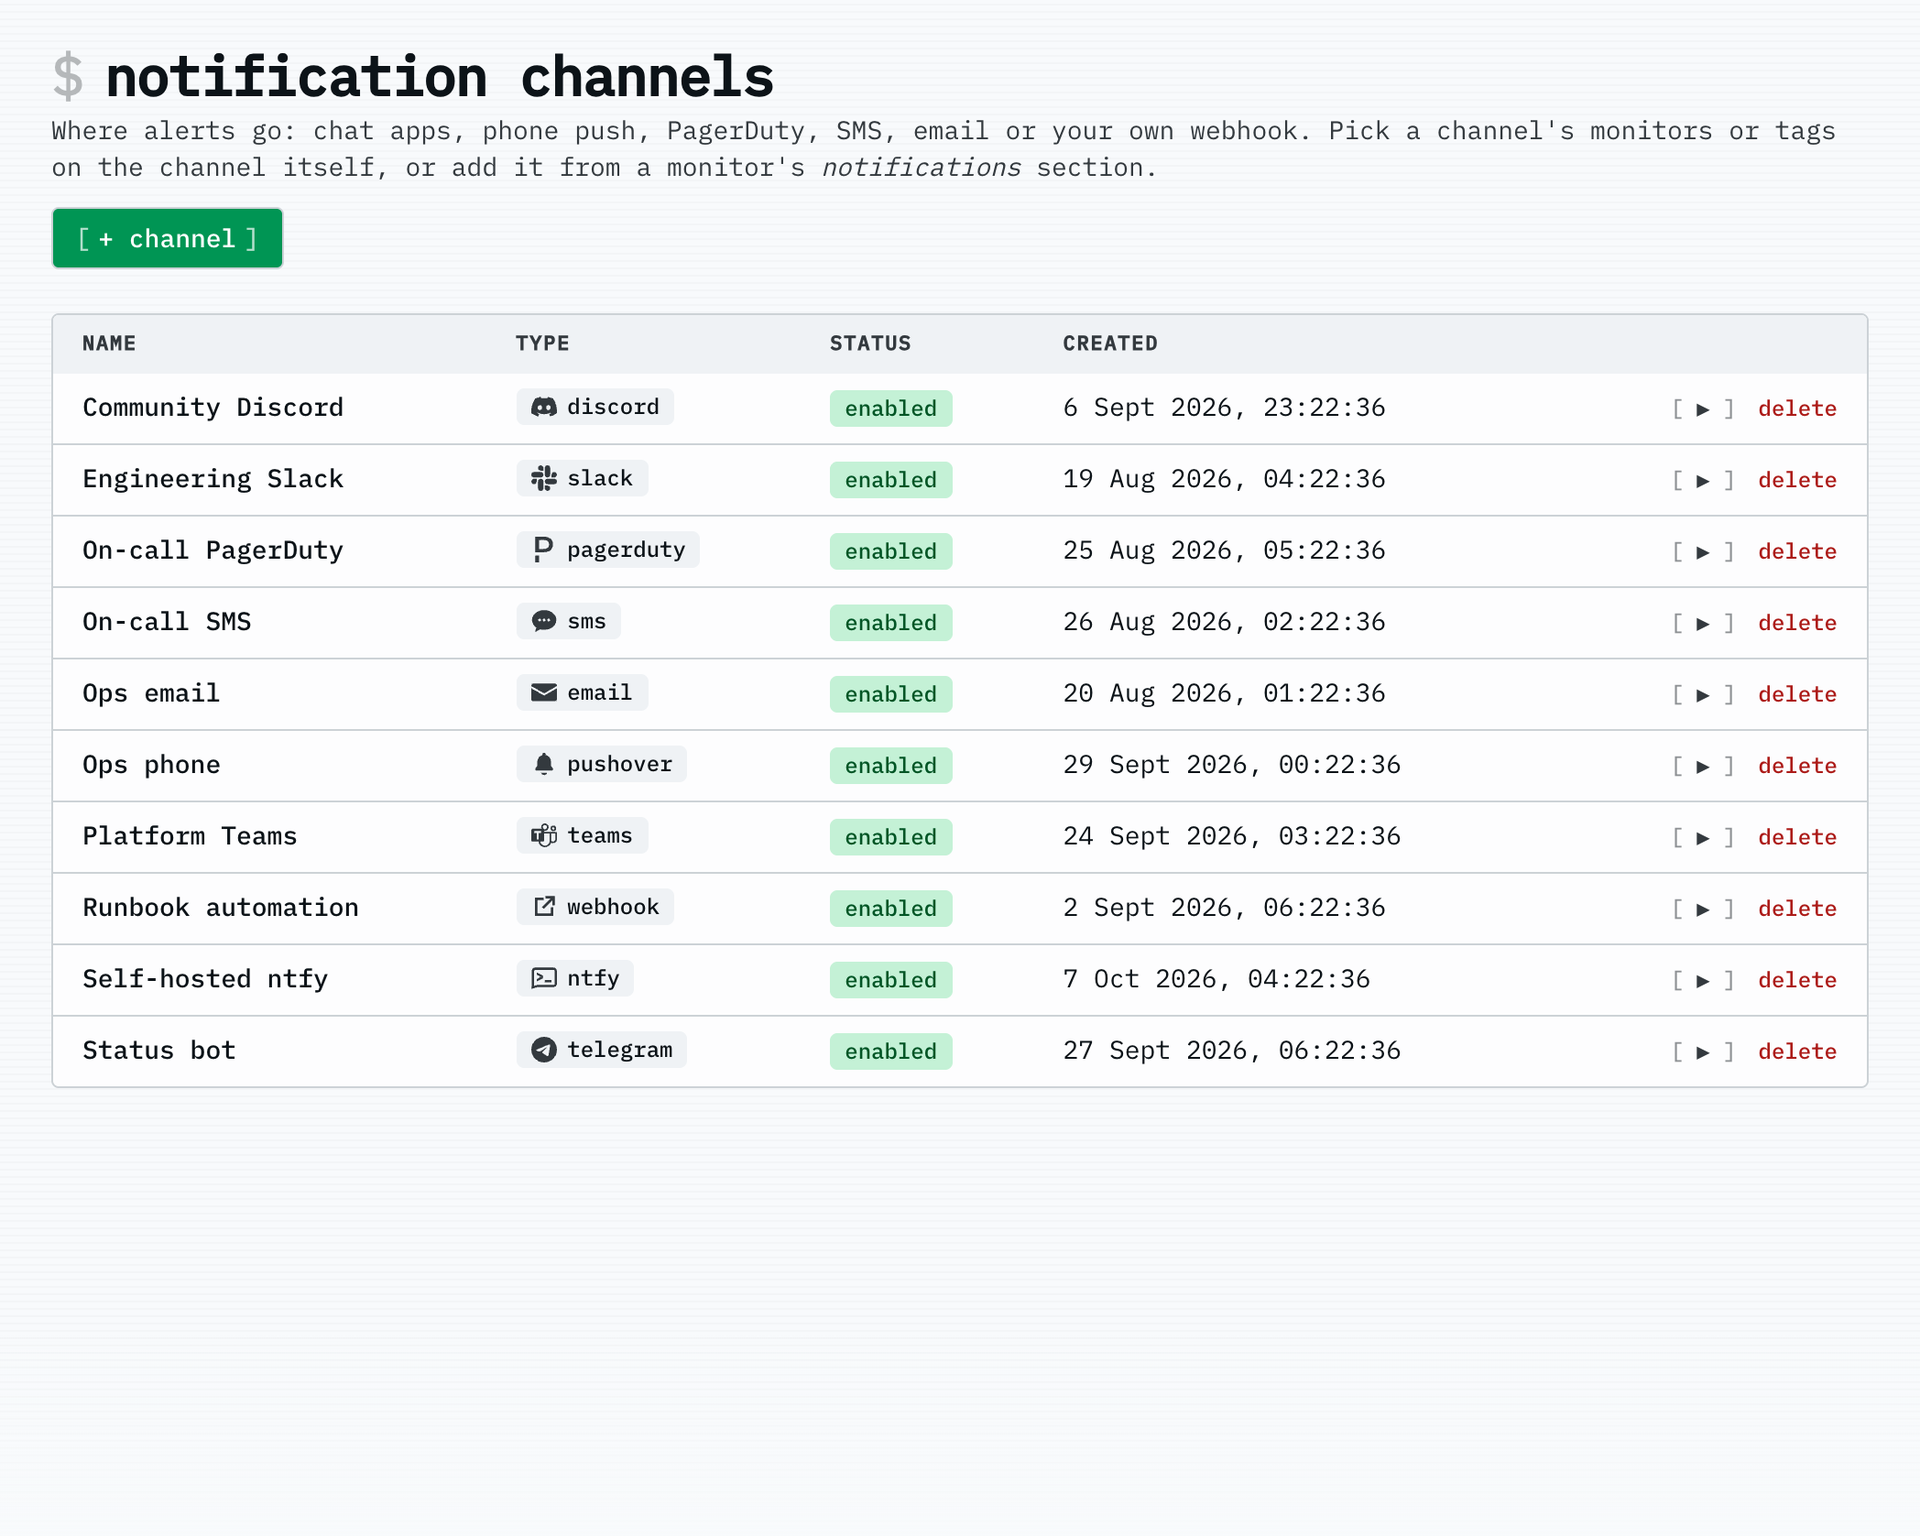
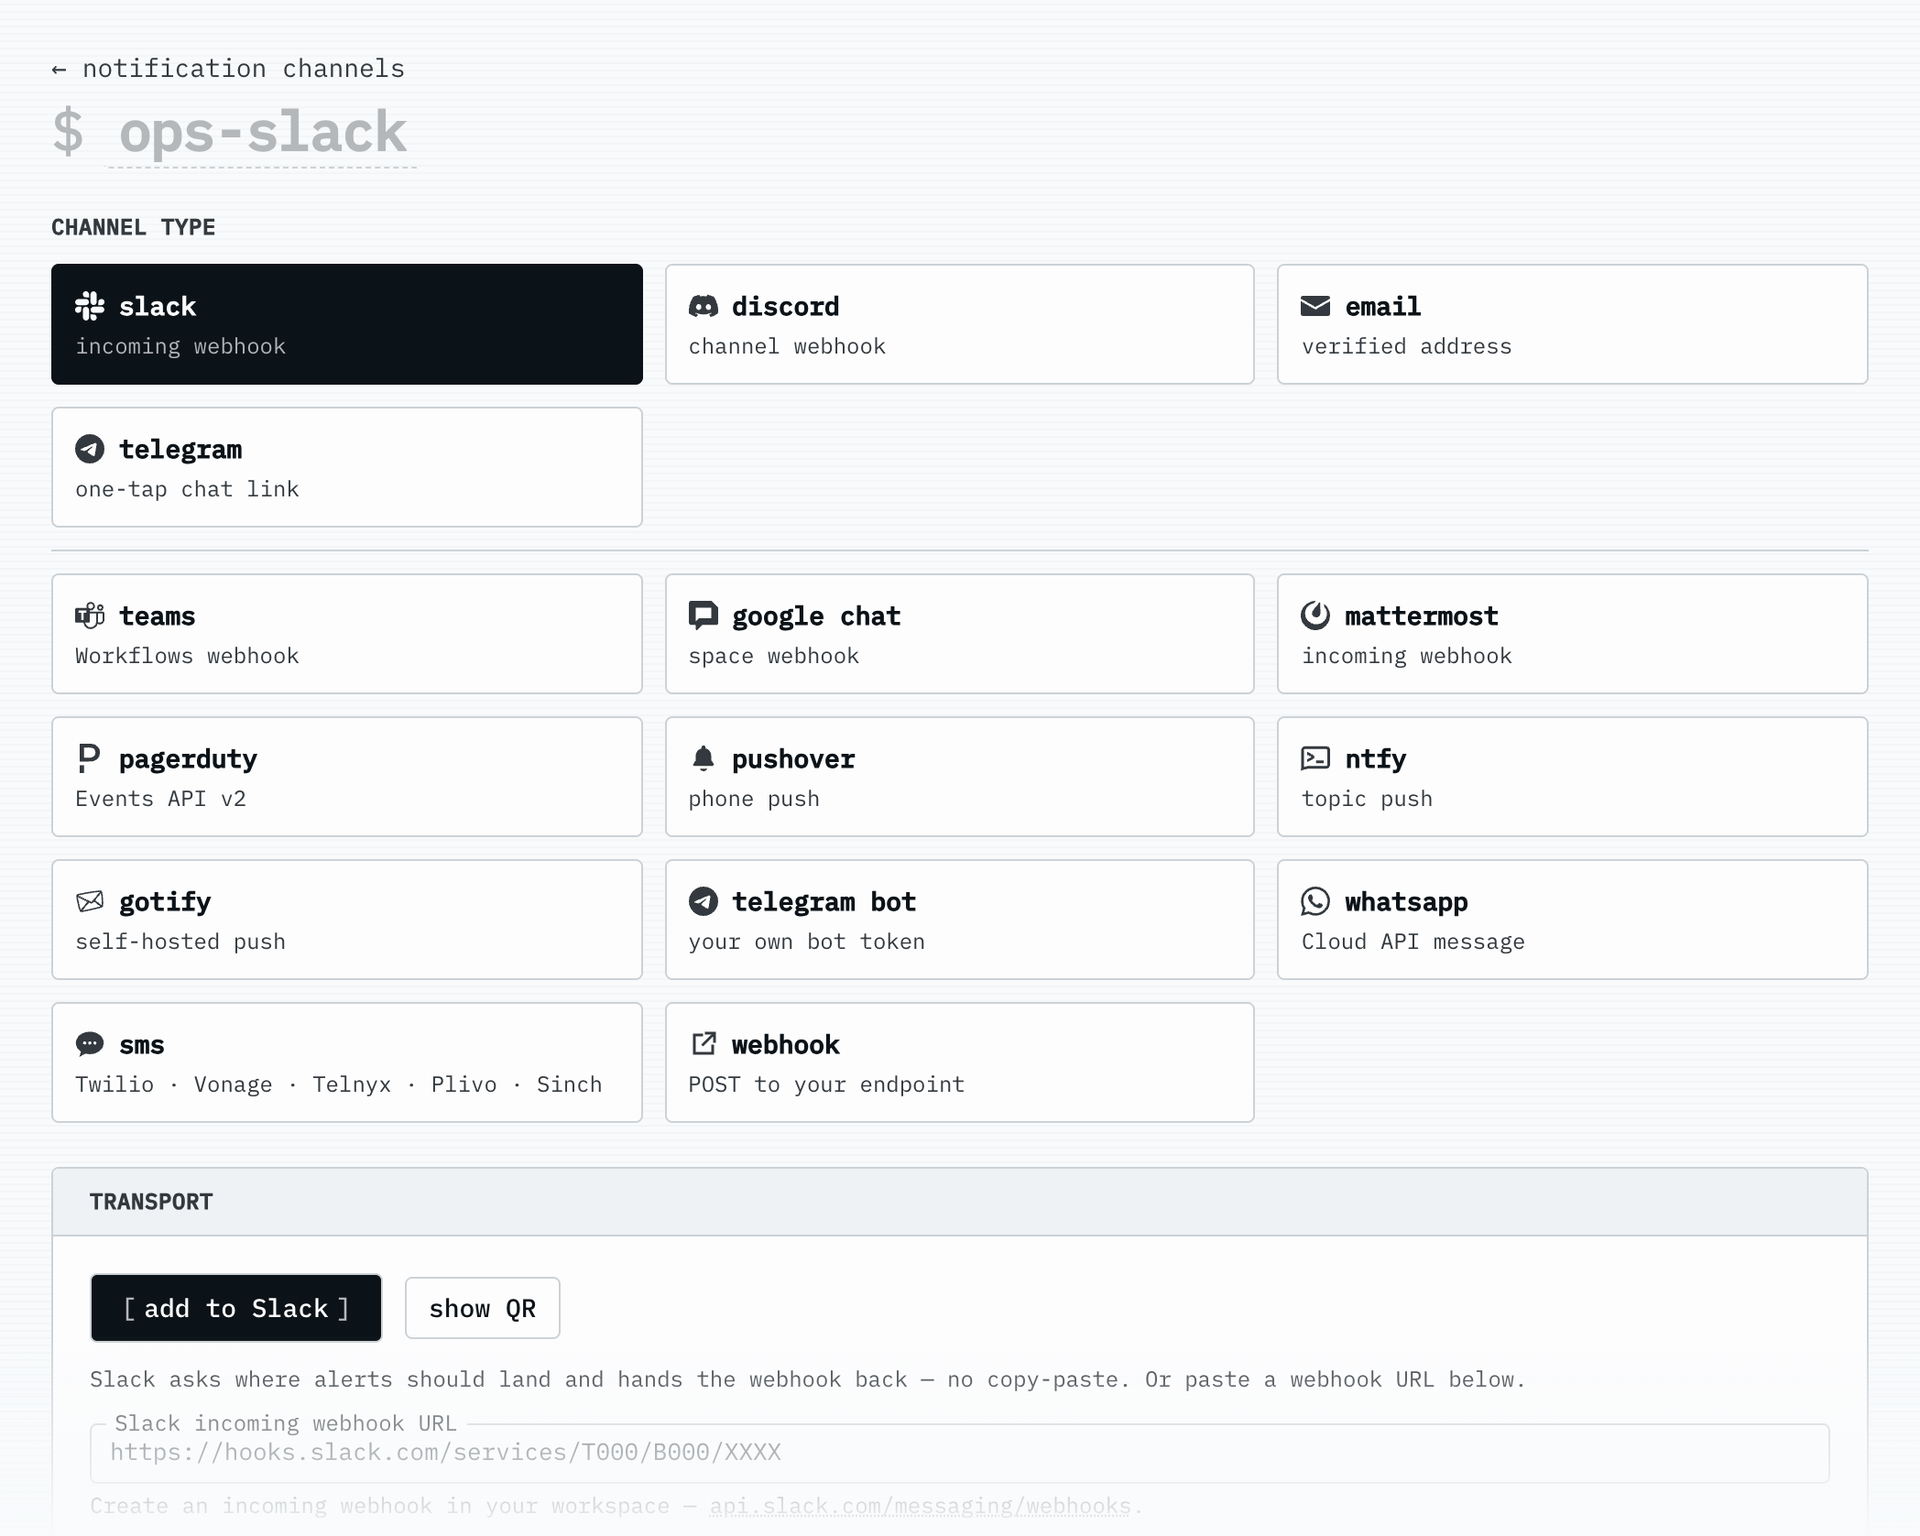
Uptime checks, a customer-facing status page, and on-call paging arrive in one self-hosted package, so a failing check can open an incident, page the right person, and update the public page without a second tool. Monitors cover HTTP, TCP, ICMP ping, DNS, TLS certificate expiry, domain expiry, cron heartbeats, and scripted browser login flows with per-step timings. Probe agents run in any region you choose, and the dashboard shows latency by region. Incidents open on failure and close on recovery, with acknowledgement to silence paging and reminders per monitor. Escalation policies page channels and schedules level by level, and layered on-call rotations support daily, weekly, or custom shifts, calendar overrides, and an iCalendar feed. Alerts reach Slack, Discord, Teams, Telegram, PagerDuty, SMS, WhatsApp, ntfy, Gotify, email, and webhooks. The public status page shows 90 days of uptime per component, maintenance windows, incident updates, and RSS, JSON, and email subscriptions. Everything can be driven by REST API, scoped tokens, a Terraform provider, or an MCP server for AI assistants. Self-hosted installs have no monitor limits and no plan to buy. Running on a dedicated VPS on RepoCloud with guaranteed CPU, RAM, and SSD, full root SSH access, and a browser serial console. AGPL-3.0 licensed.
Benefits
- Monitoring And Status In One
- Failing checks open incidents and flow onto a branded public status page automatically, so customers see problems without a separate monitoring tool or a manual post.
- The Right Person Gets Paged
- Rotations, overrides, and multi-level escalation policies decide who is paged, and alerts repeat across channels until someone acknowledges the incident.
- No Limits On Your Server
- A self-hosted install has no monitor cap, no seat count, and no plan to buy, and your check history stays in your own databases.
- Manage It As Code
- Create monitors, channels, and status pages through the REST API, scoped tokens, or the Terraform provider, and let AI assistants query the state through MCP.
Features
- Nine Check Types
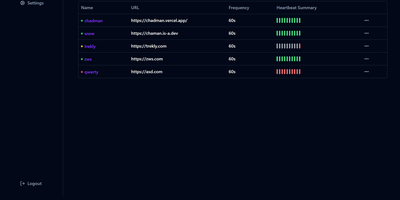
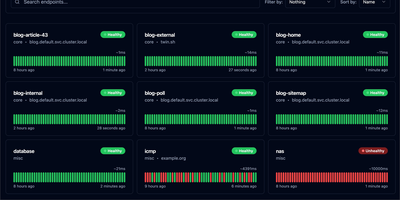
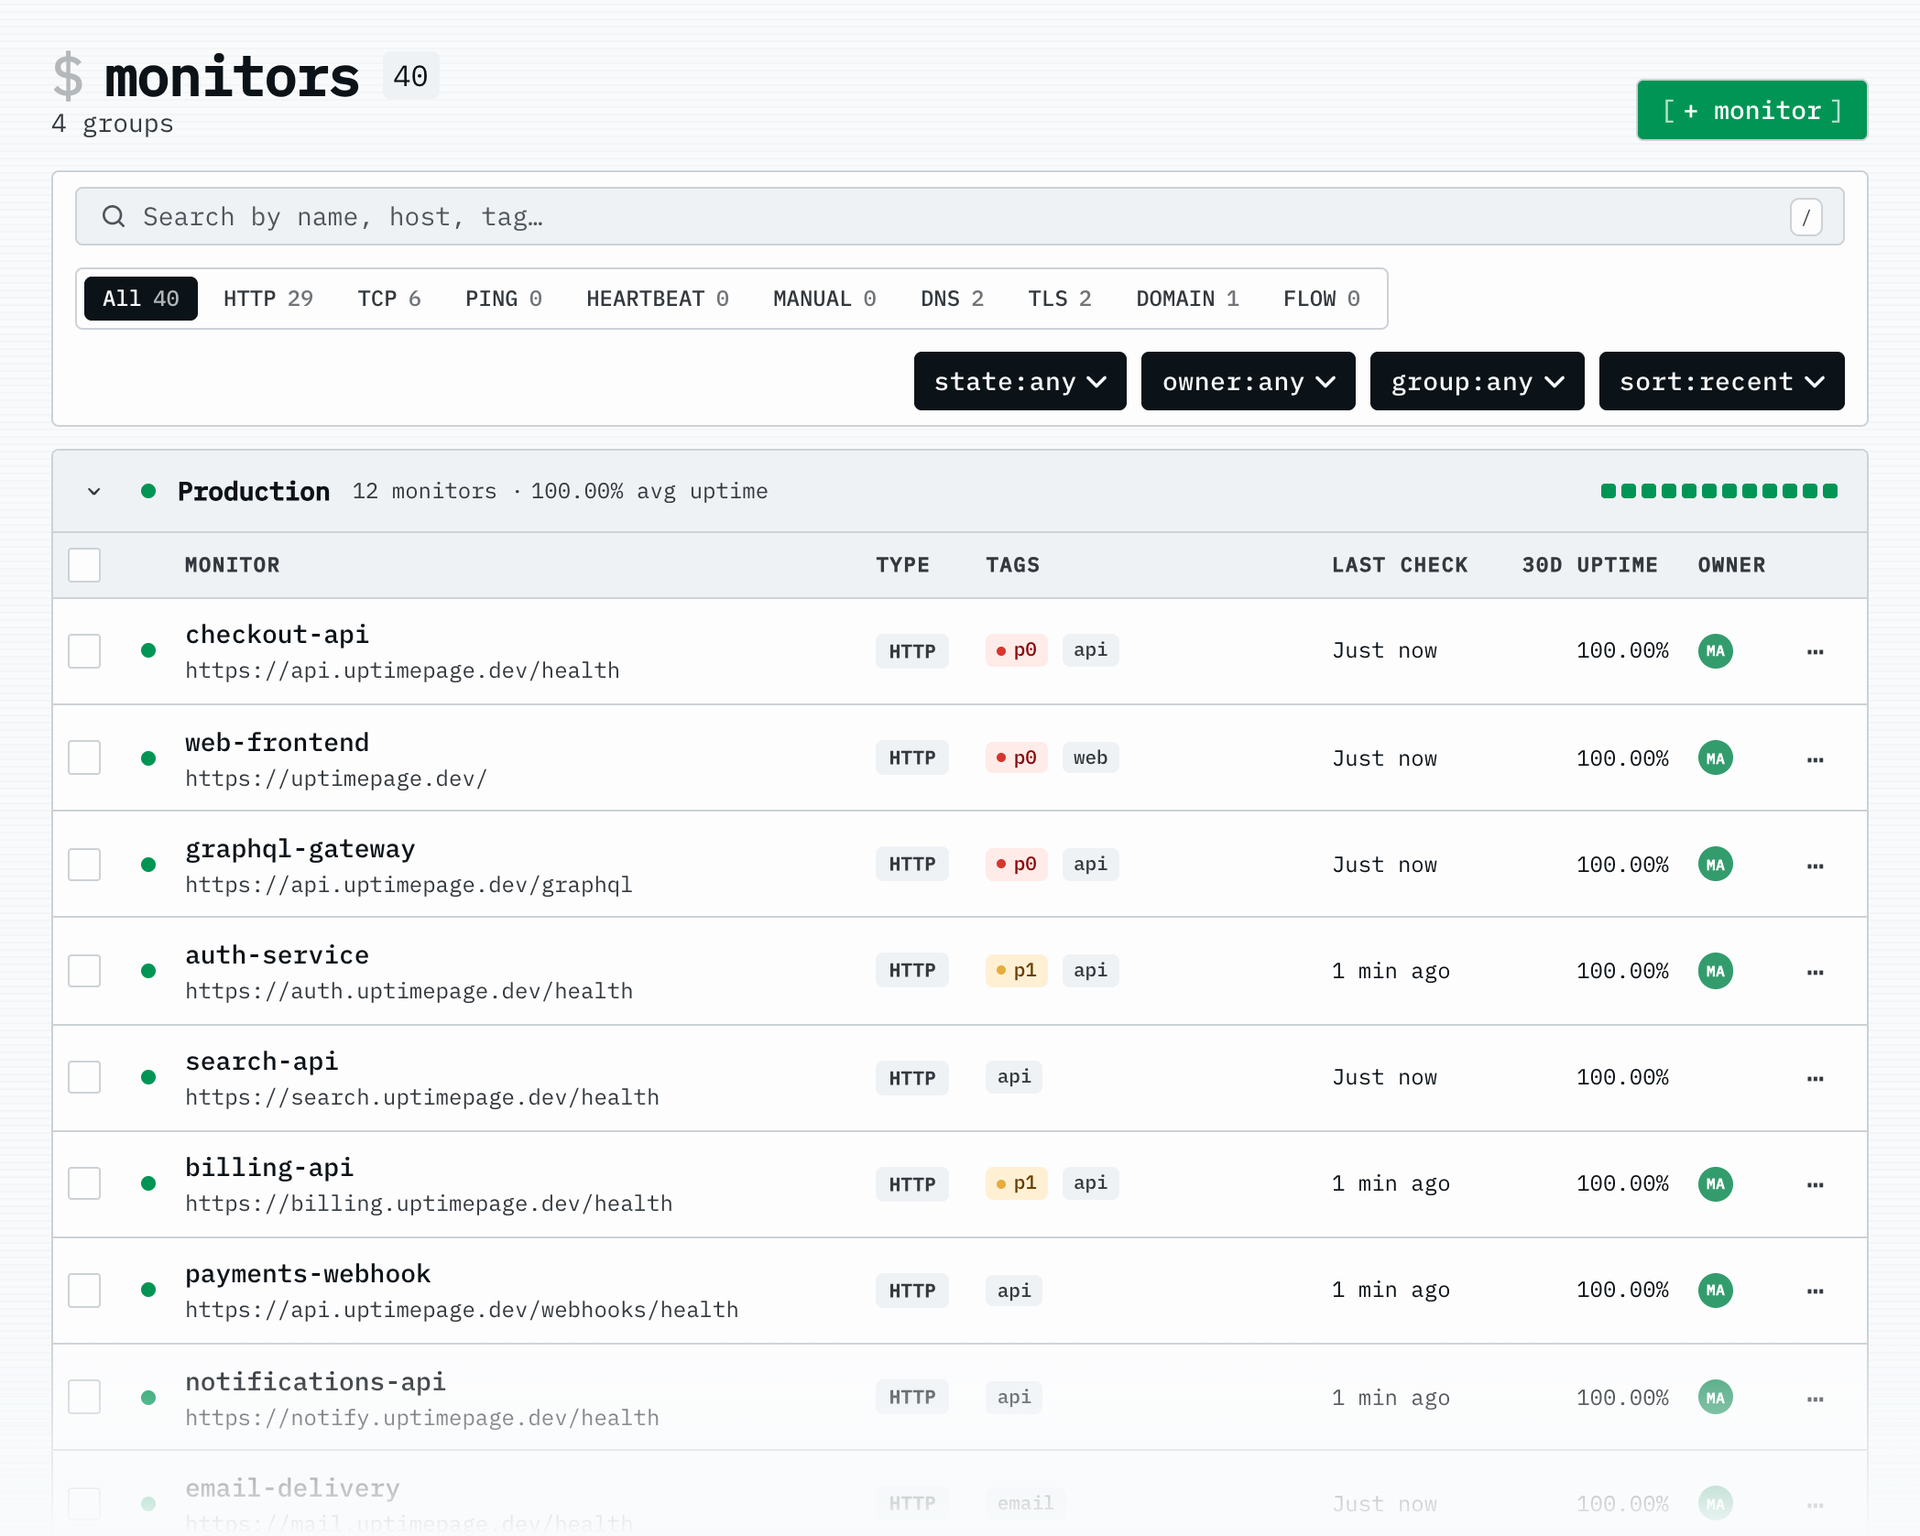
- Monitor HTTP, TCP, ping, DNS, TLS certificates, domain expiry, heartbeats, scripted browser login flows, and manually set states from one dashboard.
- Multi-Region Probes
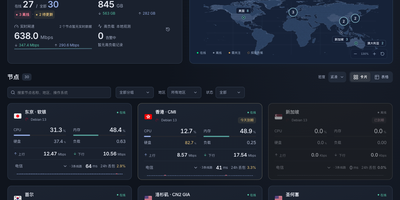
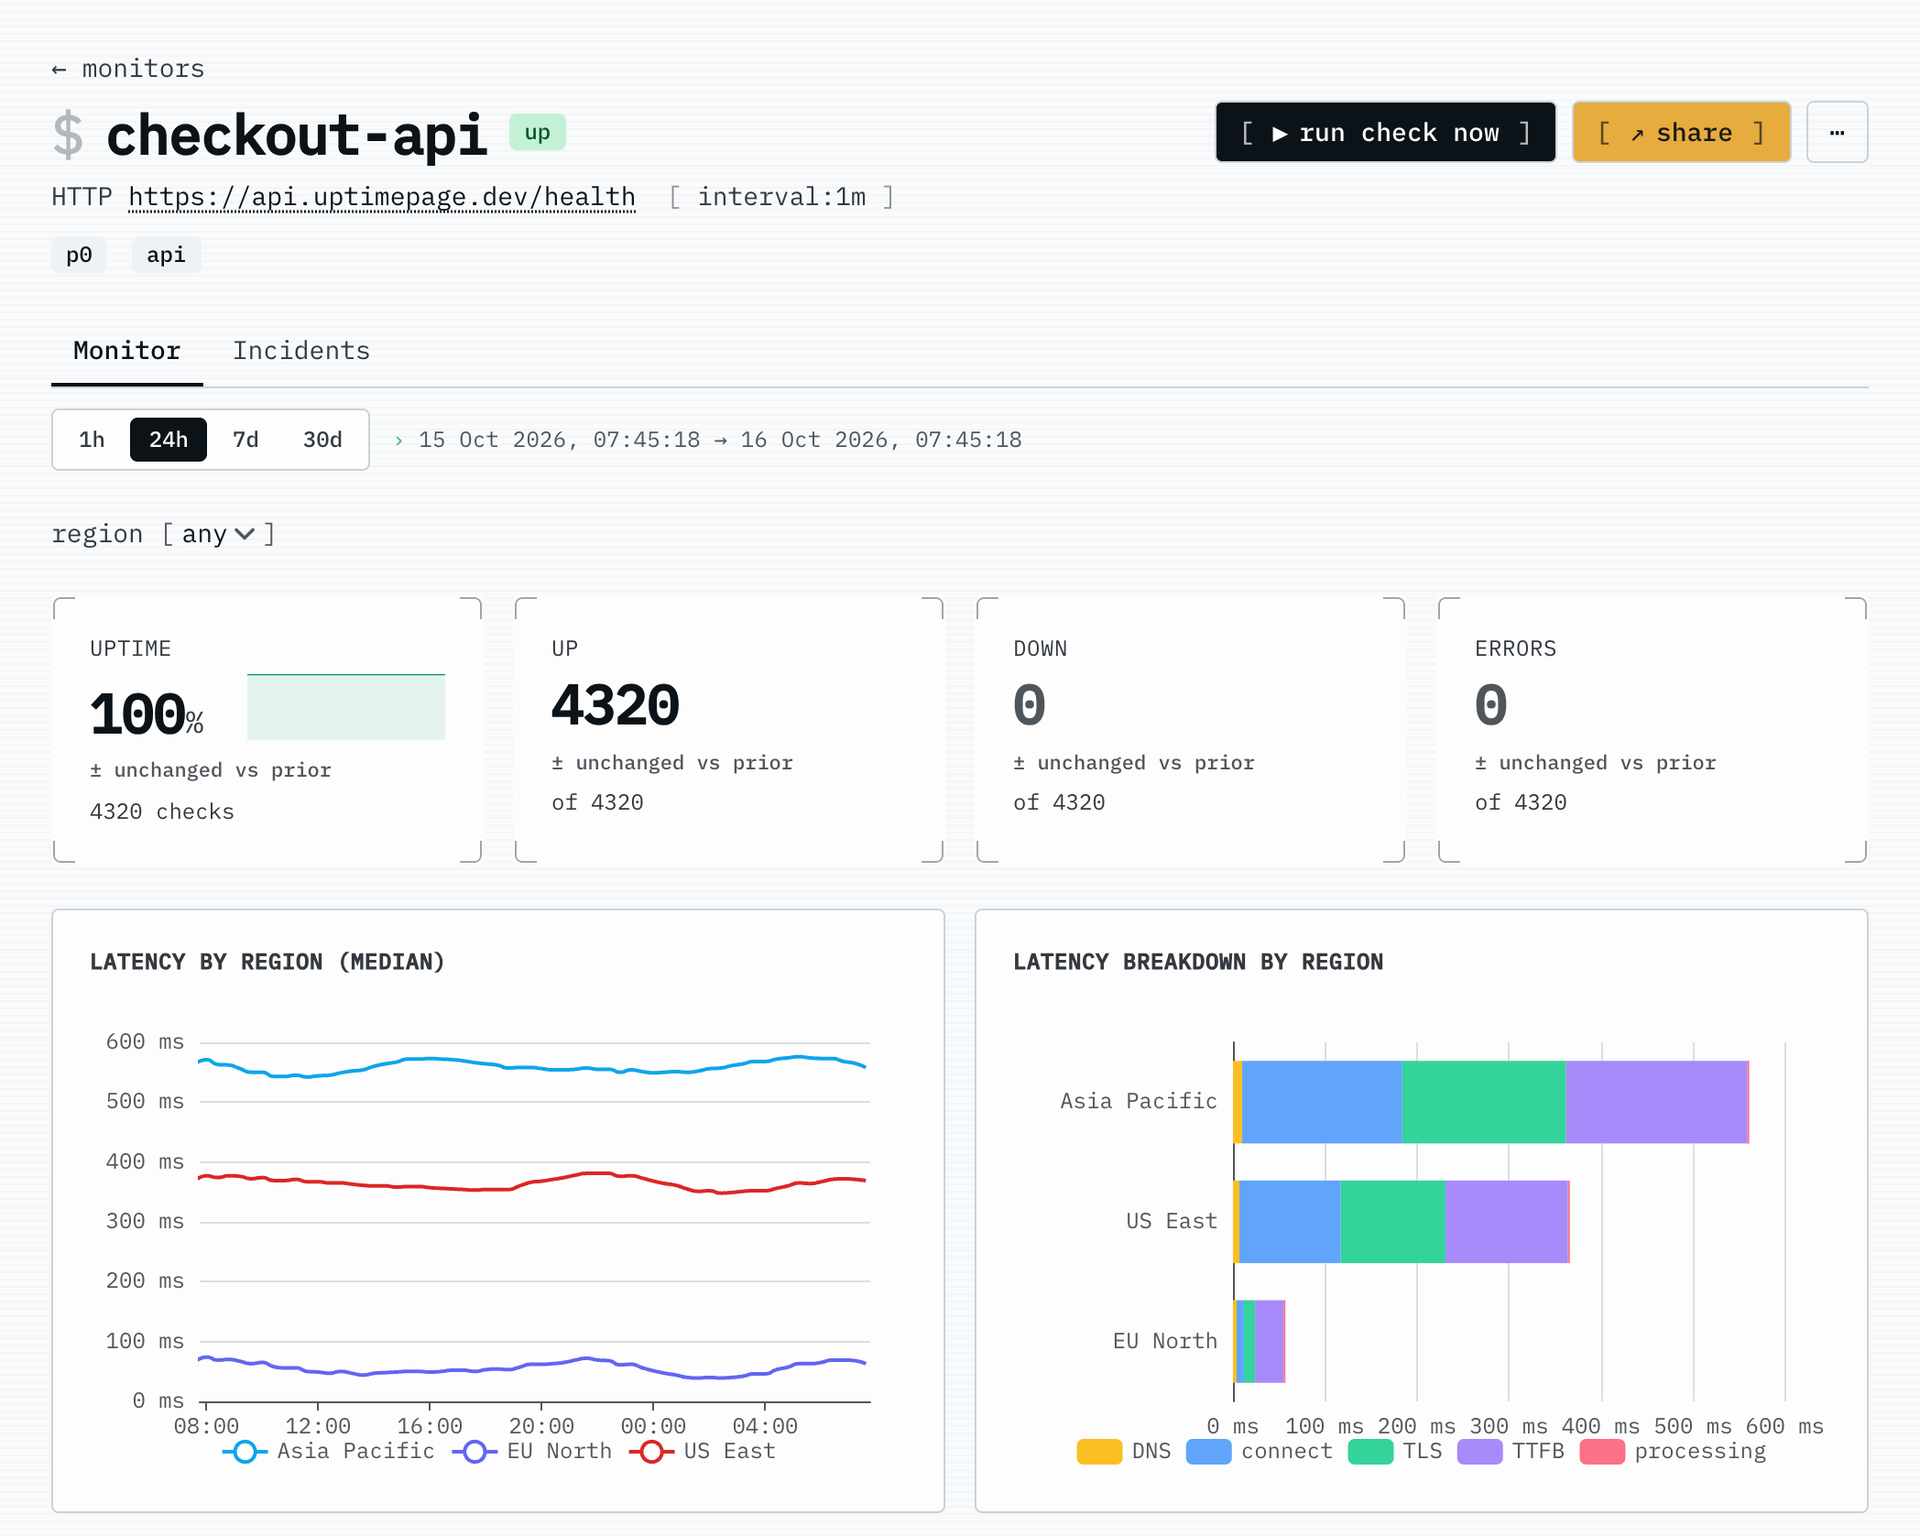
- Run probe agents in any region, compare median latency per region, and see a latency breakdown by DNS, connect, TLS, and first byte.
- Public Status Pages
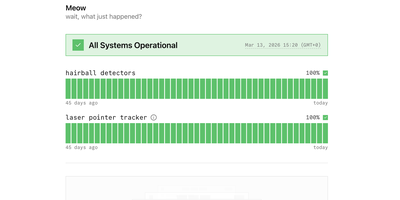
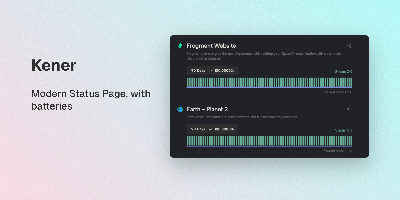
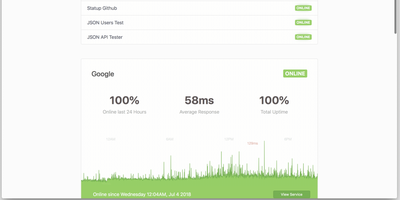
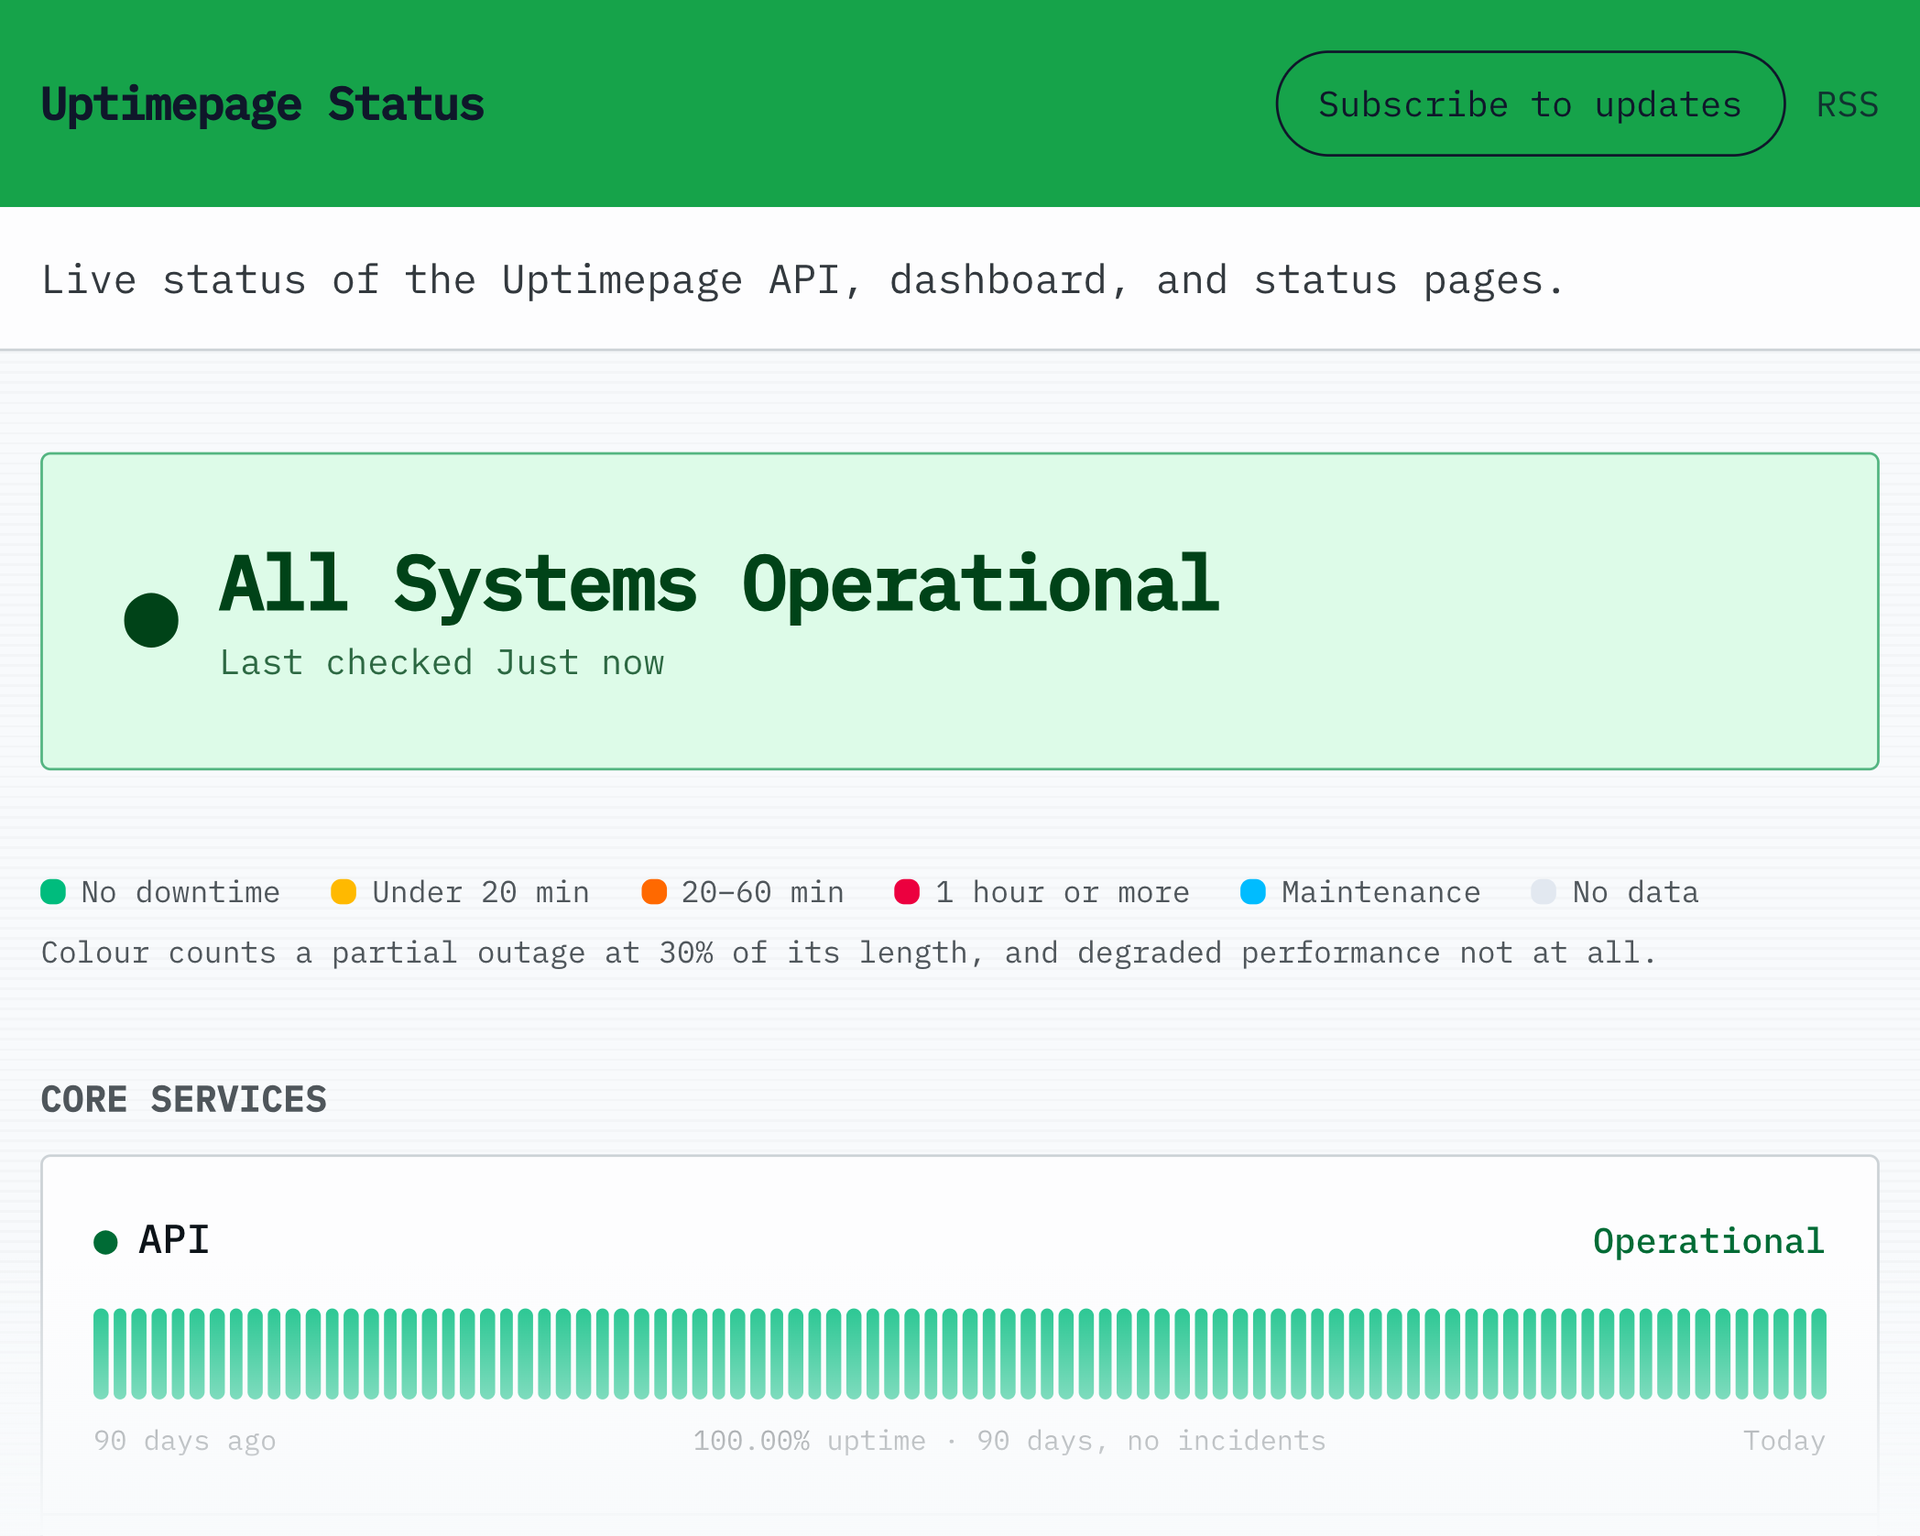
- Publish components with 90 day uptime bars, incident notes, and maintenance windows, with HTML, JSON, and RSS output and subscriber notifications.
- On-Call Schedules
- Build layered rotations with weekly hours and calendar overrides, share each person's shifts as an iCalendar feed, and bind escalation policies to monitors.
- Fourteen Alert Channels
- Send alerts to chat apps, phone push, PagerDuty, SMS, email, or a webhook, with sealed secrets and recovery messages when a monitor returns.
- API And Terraform
- Automate every resource through the REST API and scoped tokens, manage monitors with the official Terraform provider, and connect assistants through the MCP server.