Categories
self-hosted observability homelab ups-monitoring network-ups-tools infrastructure-monitoring hardware-managementStars
Forks
Watchers
Developer links
PeaNUT
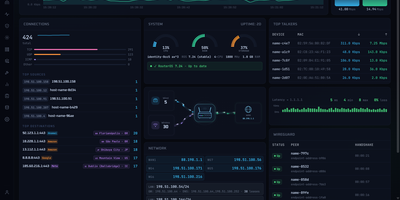
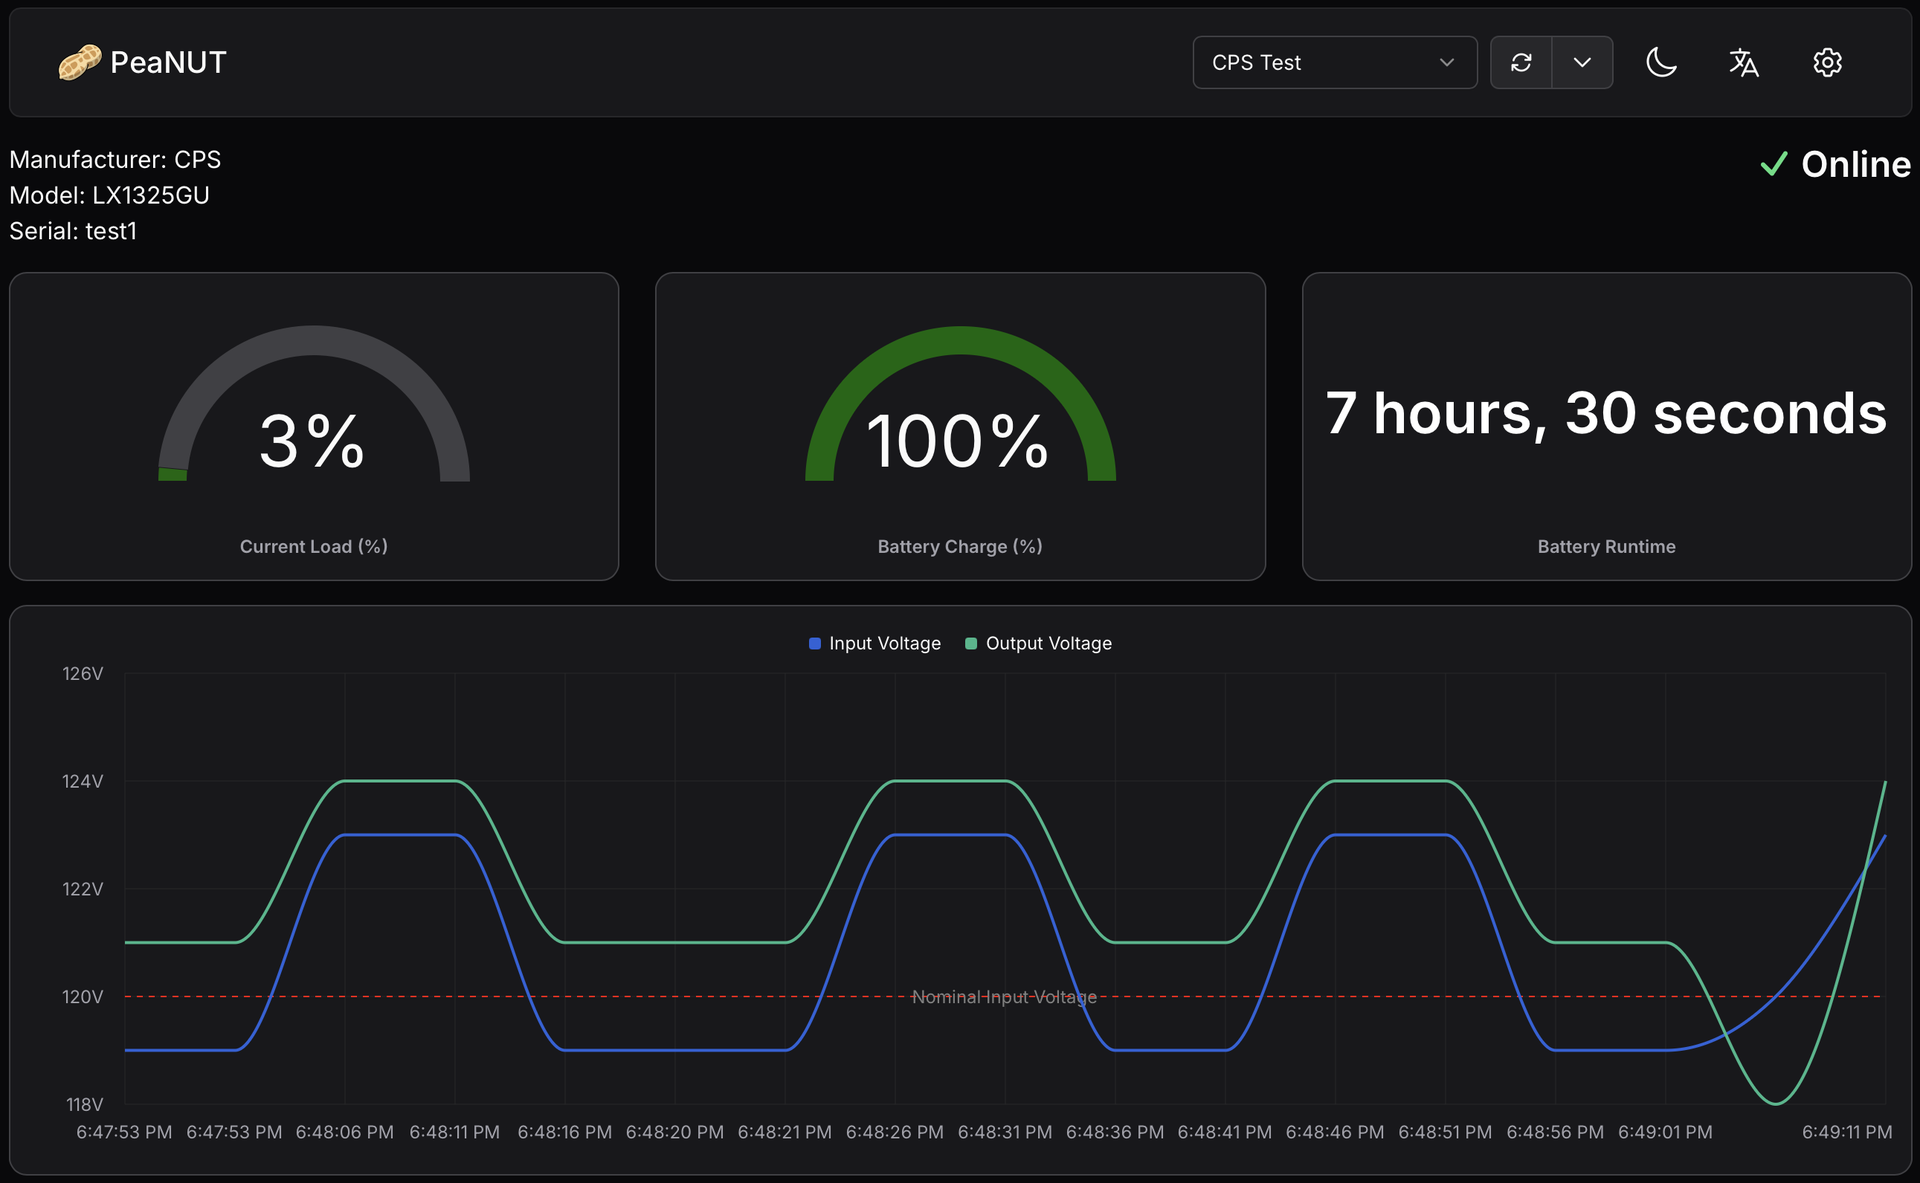
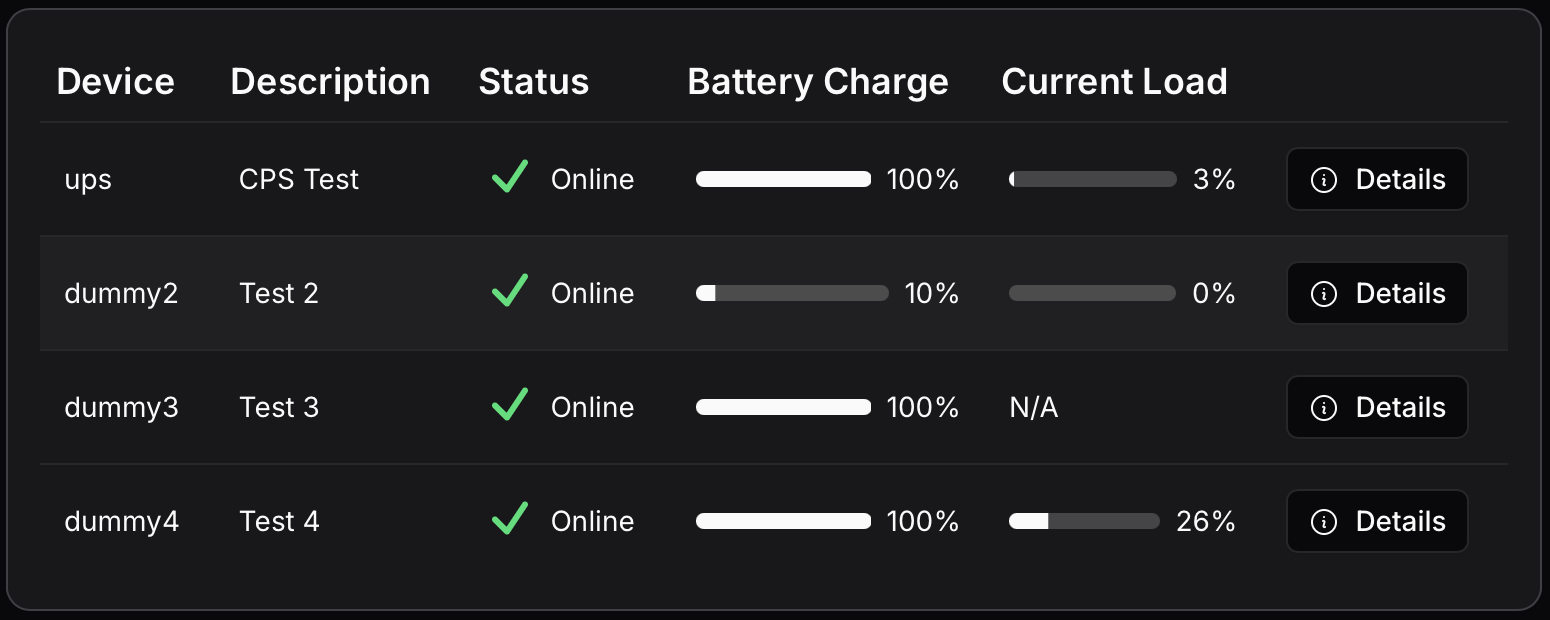
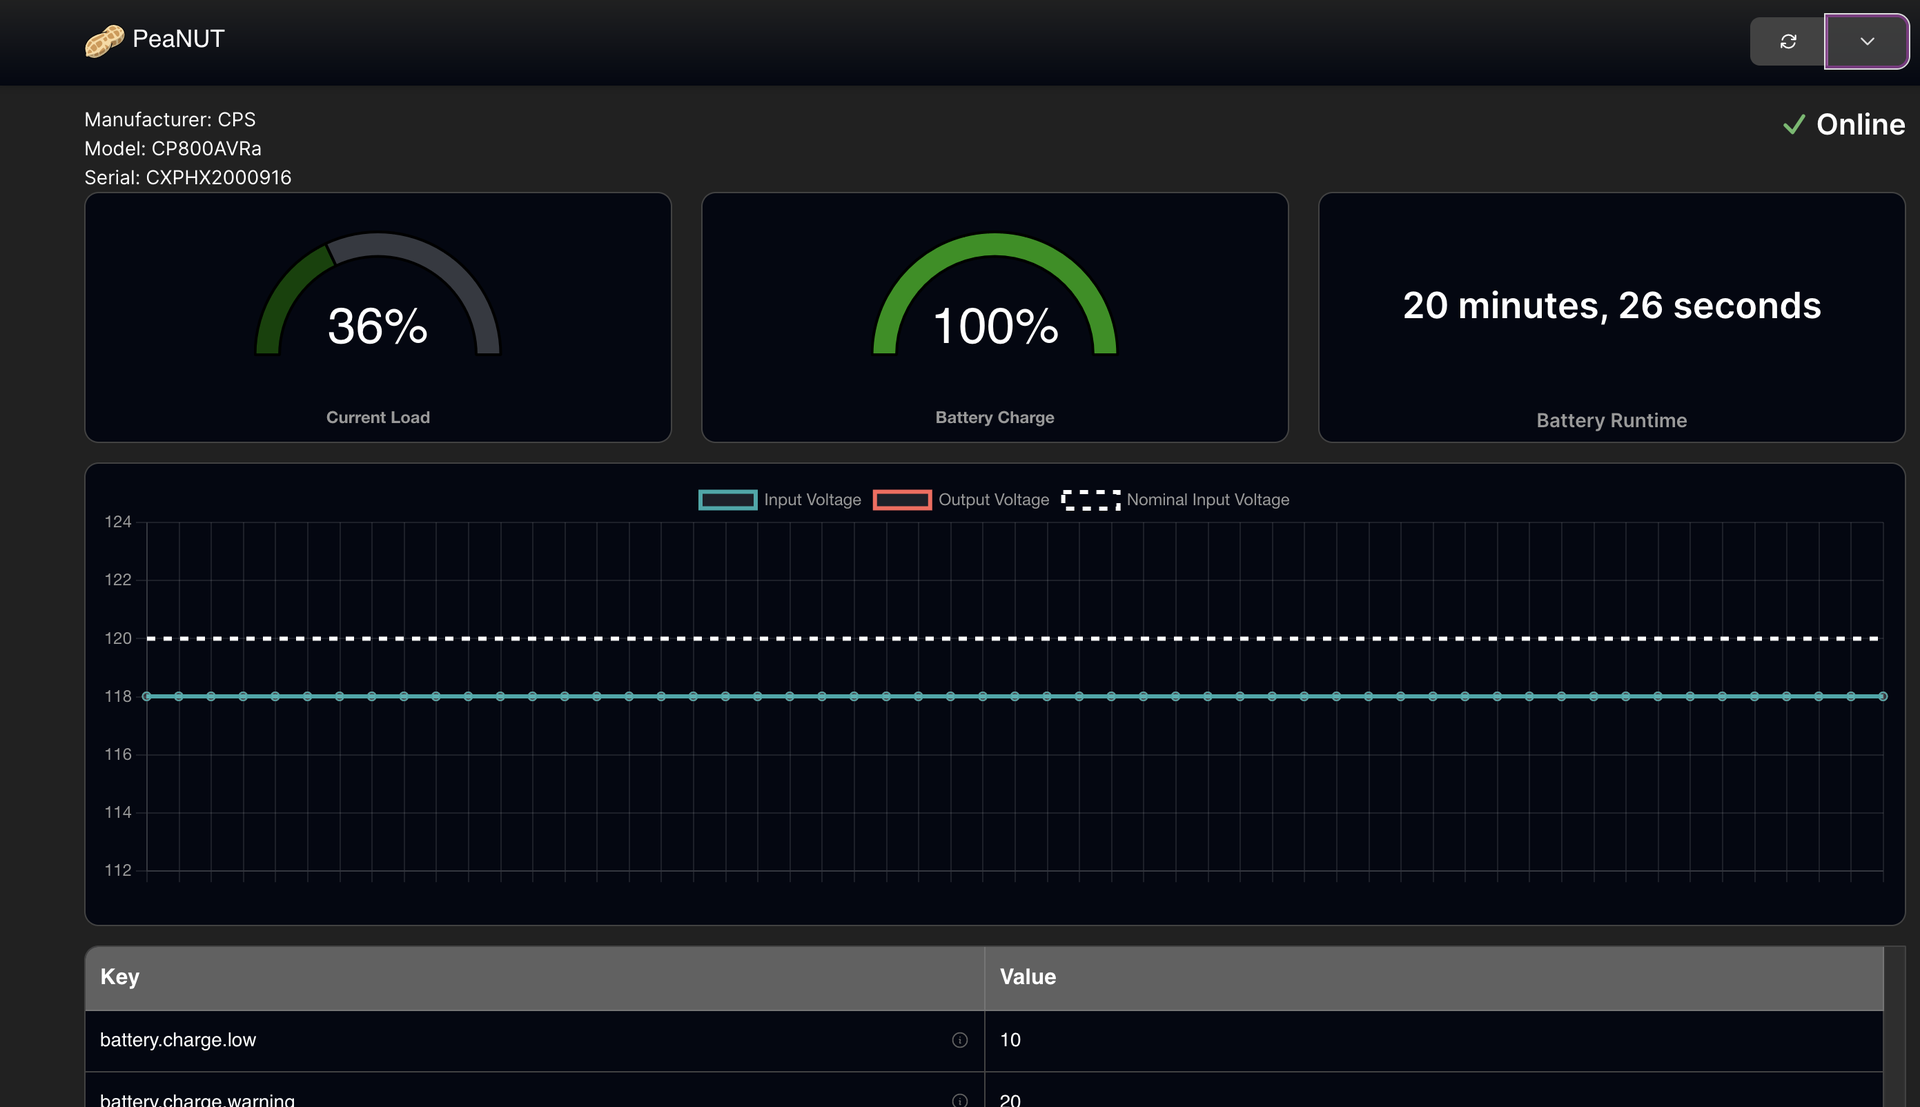
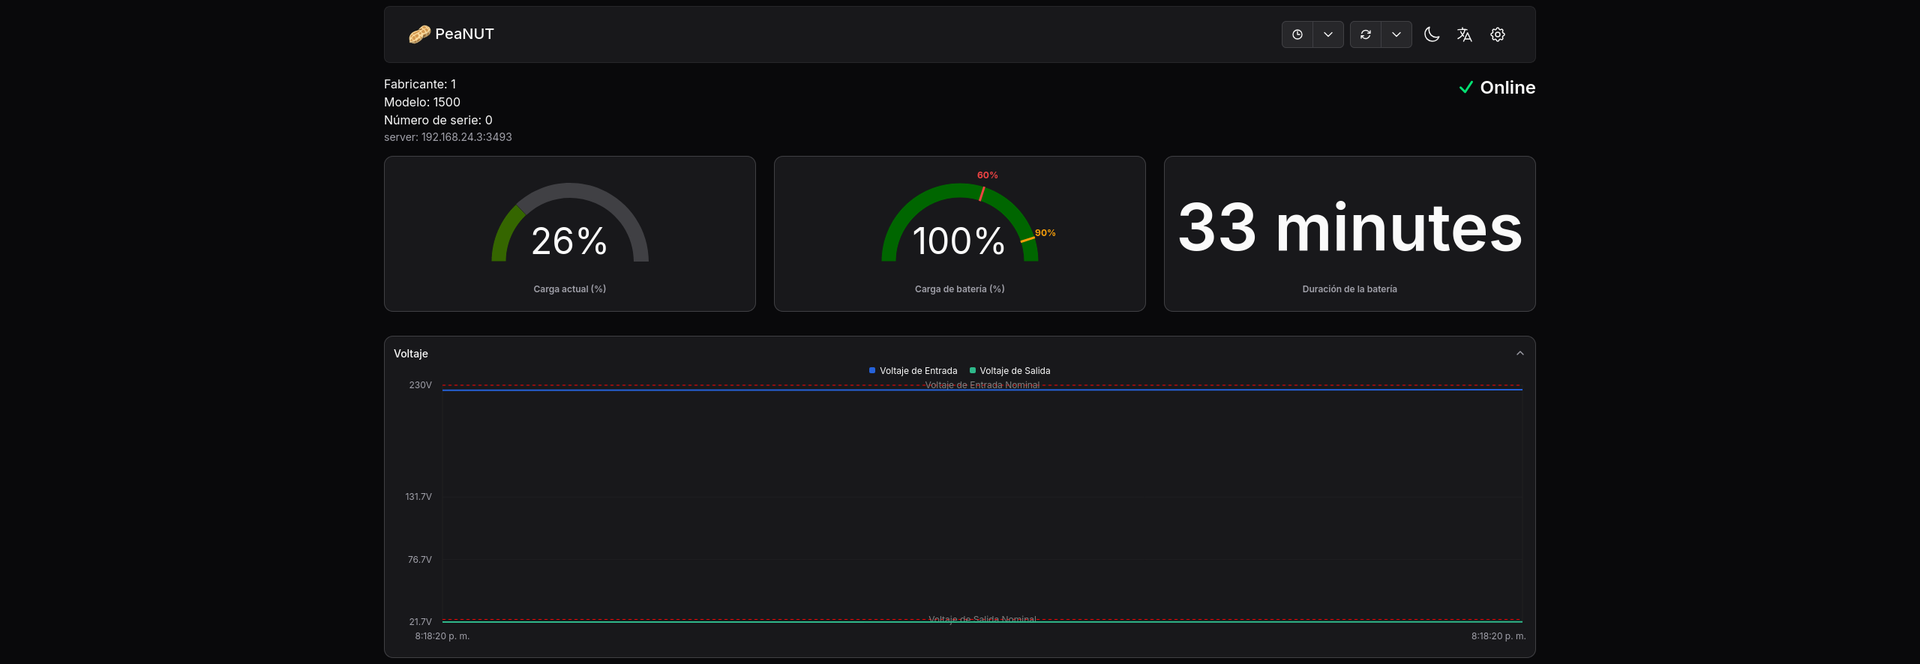
When a power outage hits your server rack, deciphering raw command-line output from Network UPS Tools should not stand between you and a safe shutdown; PeaNUT wraps your NUT servers in a real-time web dashboard that monitors battery charge, load capacity, and voltage telemetry across every uninterruptible power supply on your network. Operators can connect multiple local or remote NUT servers into a single interface and switch between devices with one click. Live gauges track battery percentage, estimated runtime, real power draw in watts, and apparent power in volt-amperes. Interactive line charts plot input and output voltage alongside load fluctuations over time. Need to test a battery or silence an alarm? You can execute instant UPS hardware commands, edit writable device variables, or open a browser-based terminal directly to the underlying NUT daemon without leaving the web interface. Configuration works either through the visual settings panel or a declarative YAML file, protected by built-in account authentication. For broader infrastructure observability, you can stream time-series power data to InfluxDB v2, scrape the native Prometheus metrics endpoint into Grafana, query the REST and WebSocket APIs, or embed live UPS status cards inside Homepage and Glance dashboards. Running on a dedicated VPS on RepoCloud with guaranteed CPU, RAM, and SSD, full root SSH access, and a browser serial console. Apache-2.0 licensed.

Benefits
- Centralized Multi-UPS Fleet Visibility
- Aggregate multiple Network UPS Tools servers into a unified web interface to monitor battery charge, runtime remaining, wattage load, and online or battery status across every rack.
- Direct Hardware Command and Variable Control
- Trigger UPS self-tests, beeper toggles, and load cycling commands or modify writable NUT device parameters directly from the browser UI and integrated WebSocket terminal.
- Prometheus and InfluxDB v2 Telemetry
- Export real-time power metrics to Prometheus on /api/v1/metrics or push historical voltage and load time-series records to InfluxDB v2 for custom Grafana alerting dashboards.
- Ready-Made Homelab Dashboard Widgets
- Query the authenticated REST API to display live battery percentage, runtime duration, and power load inside Homepage, Glance, and custom automation scripts.
Features
- Real-Time Voltage Charts
- Visualize input voltage, output voltage, nominal voltage, and real-time wattage load curves alongside radial gauges for battery charge and UPS load percentage.
- Interactive NUT Variable Table
- Inspect the complete tree of NUT device variables, enum ranges, and parameter descriptions, with inline editing support for read-write UPS configuration keys.
- Browser NUT Terminal
- Communicate directly with connected Network UPS Tools servers over a WebSocket-backed terminal session and trigger instant hardware commands from a dropdown menu.
- UI and YAML Configuration
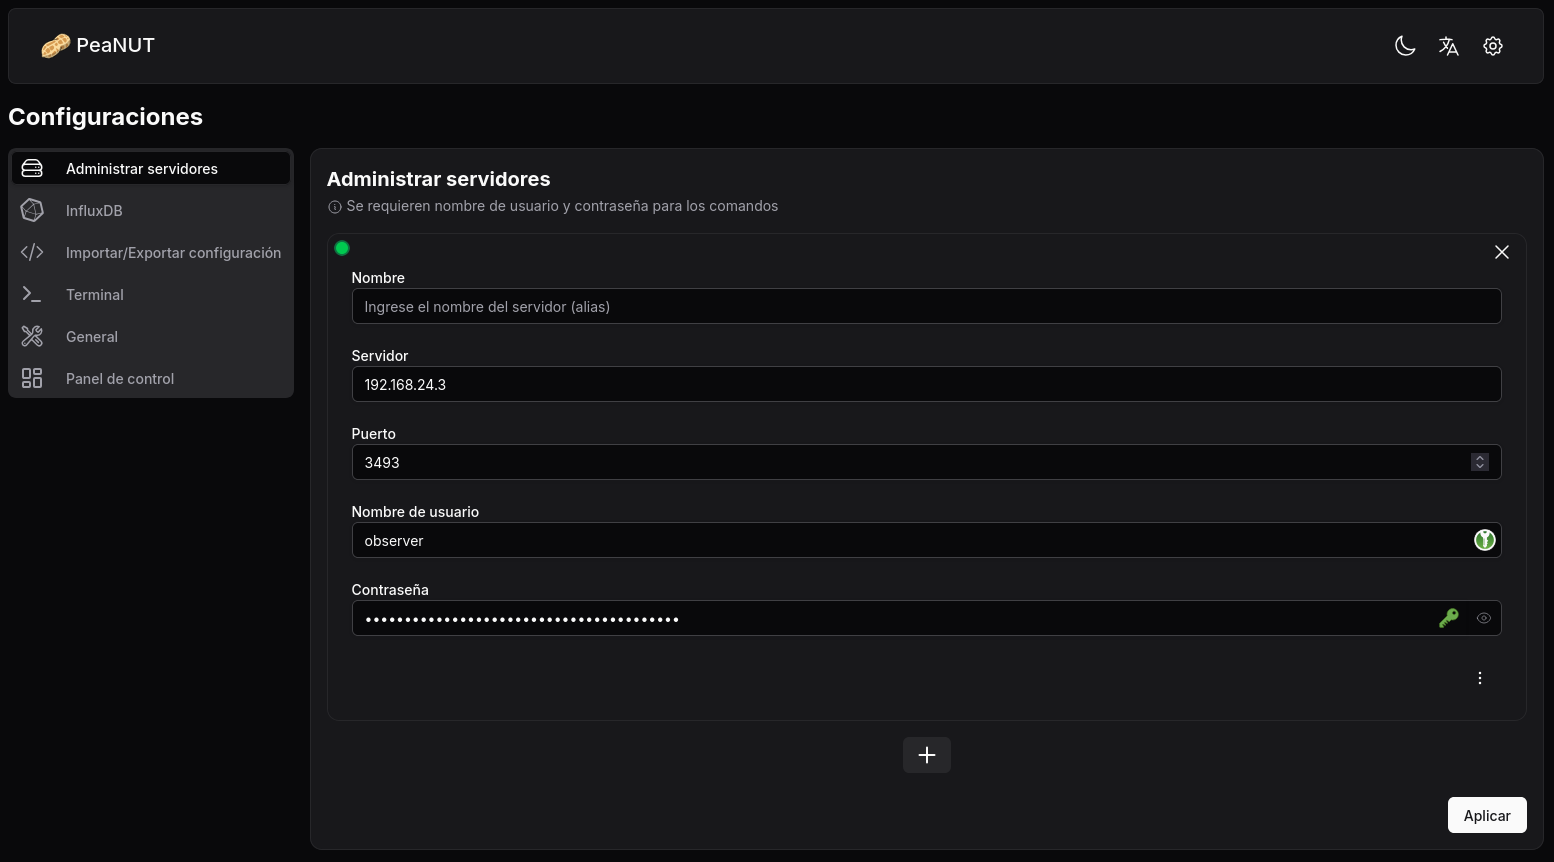
- Manage NUT server hosts, ports, credentials, InfluxDB connections, and customizable dashboard layouts through the visual settings modal or a persistent settings.yml file.
- Comprehensive REST API
- Access Basic Auth protected endpoints under /api/v1/devices and /api/v1/metrics to retrieve device variables, connected NUT clients, and Prometheus telemetry.