Categories
Self-Hosted DevOps Observability Reverse Proxy Privacy Tools Server Monitoring Web Analytics Log AnalyticsStars
Forks
Watchers
Developer links
NginxPulse
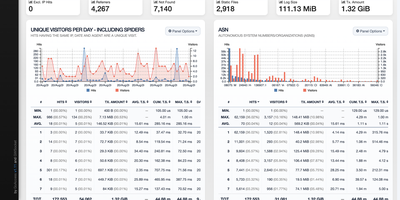
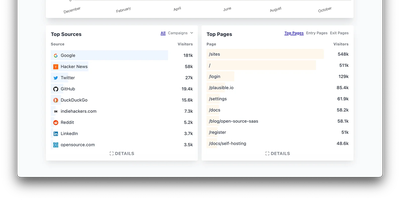
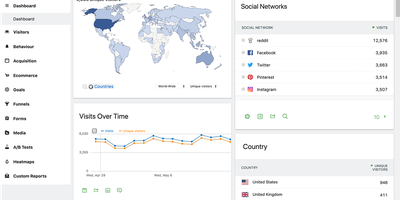
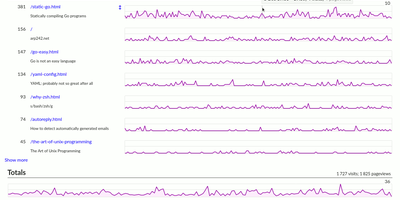
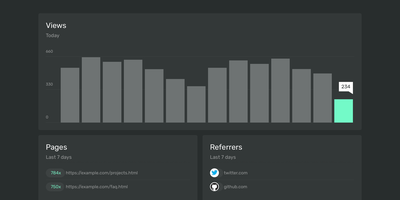
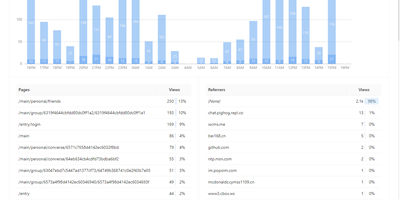
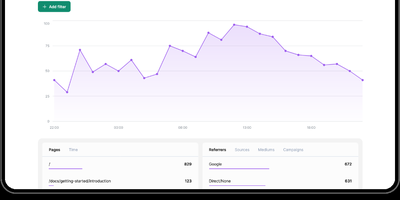
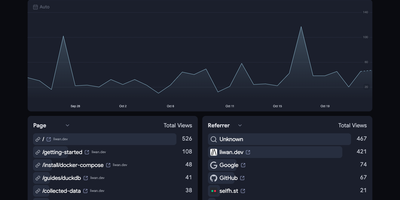
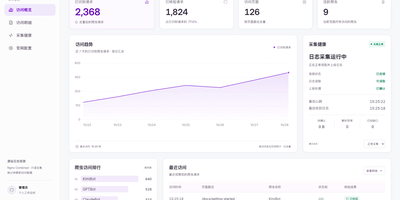
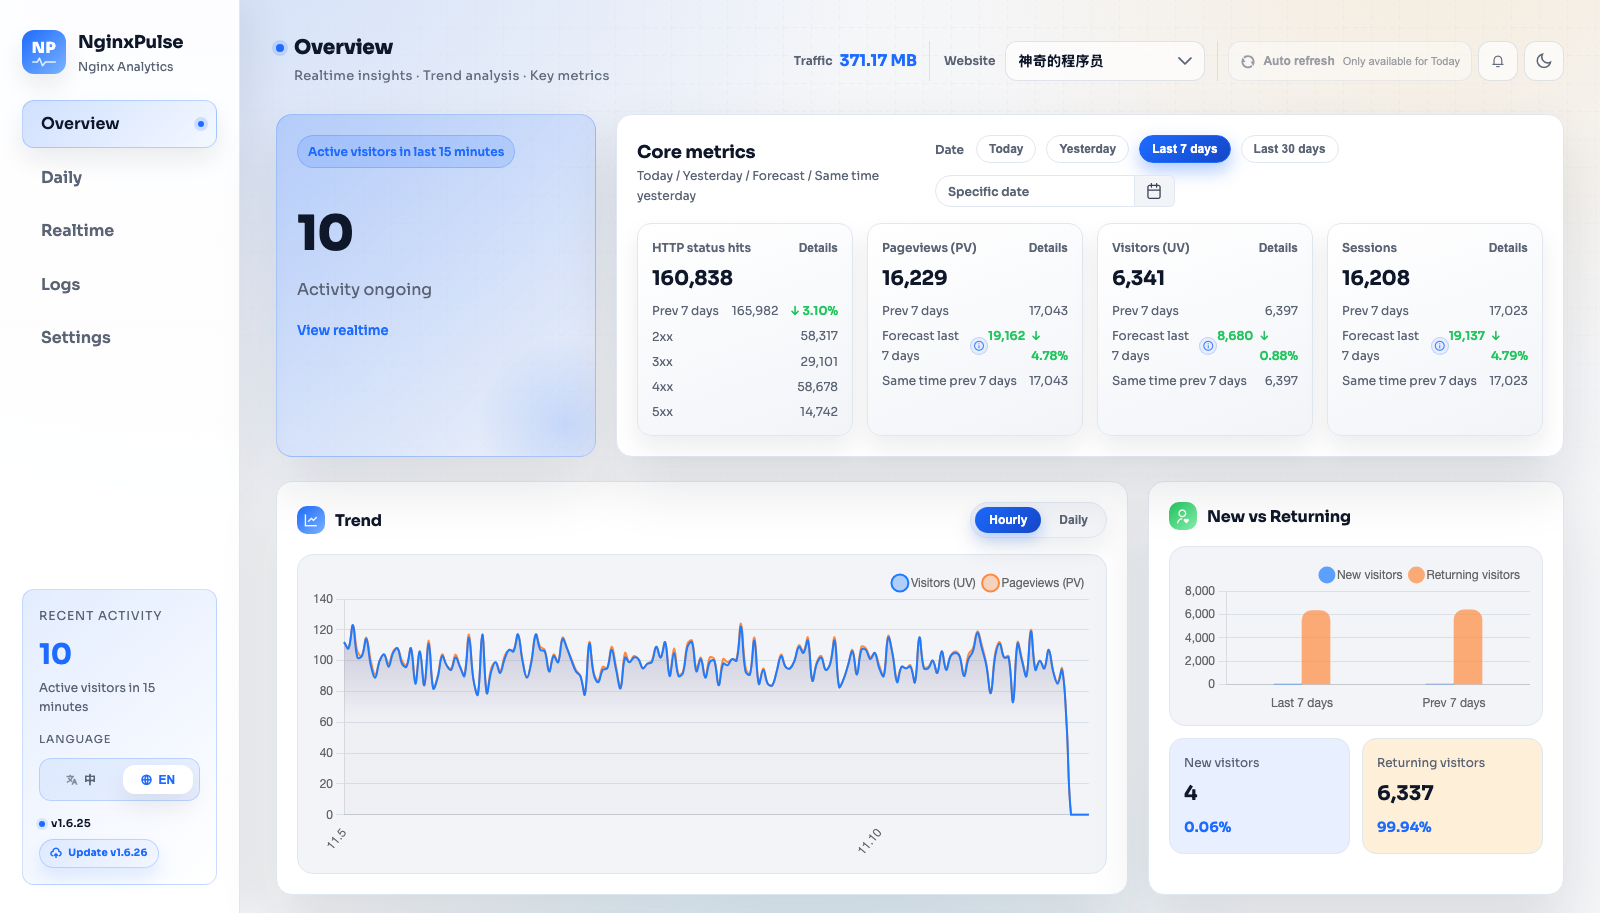
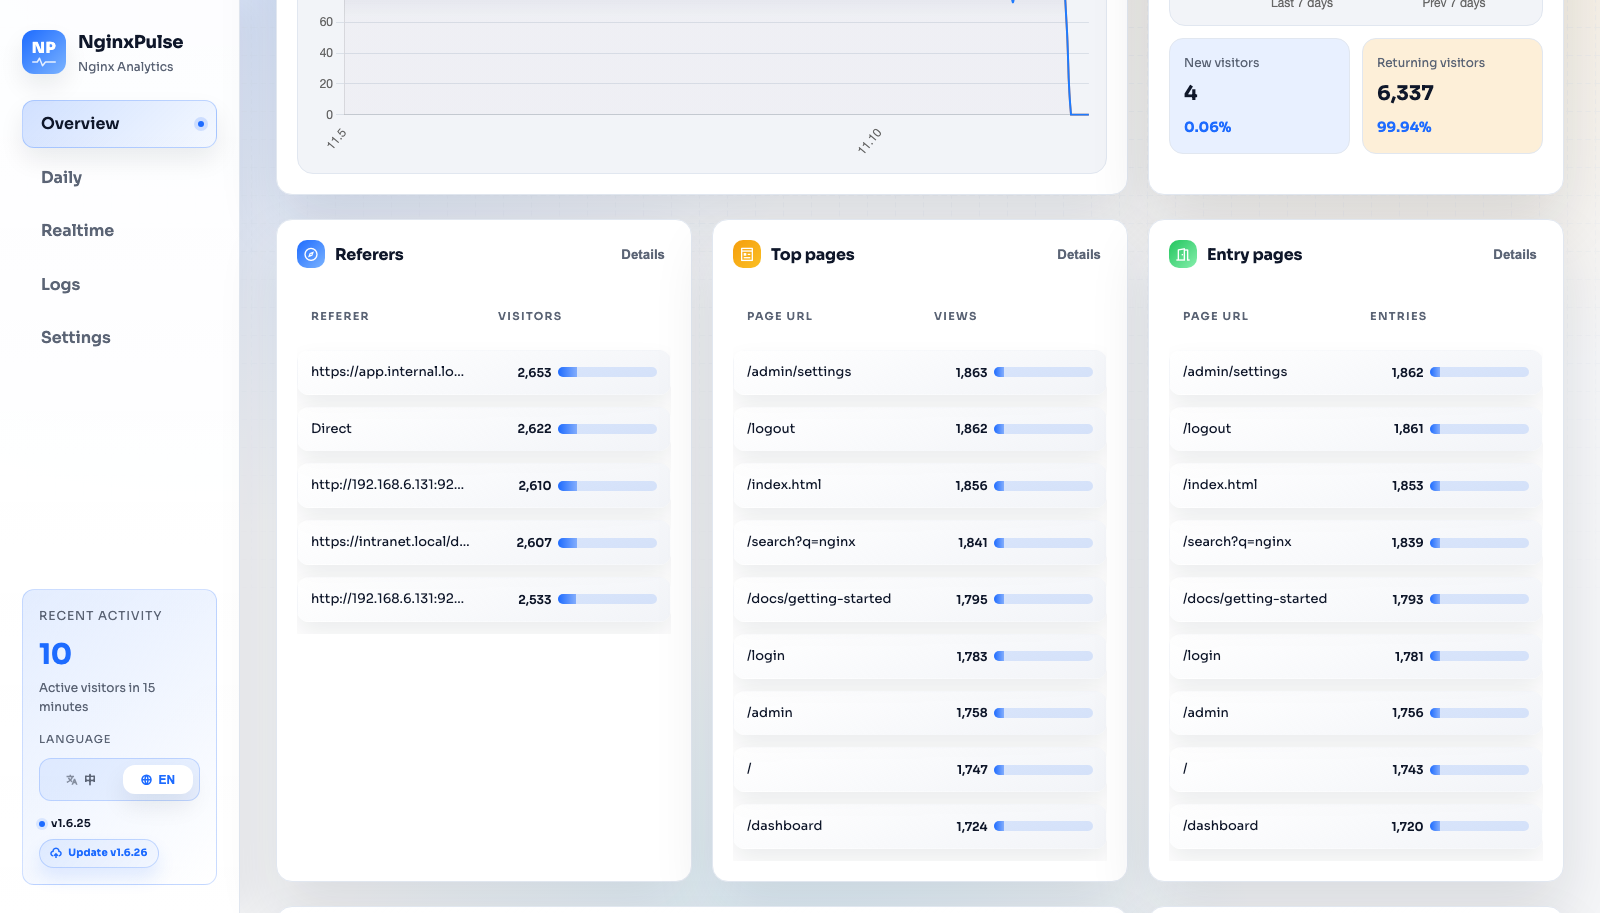
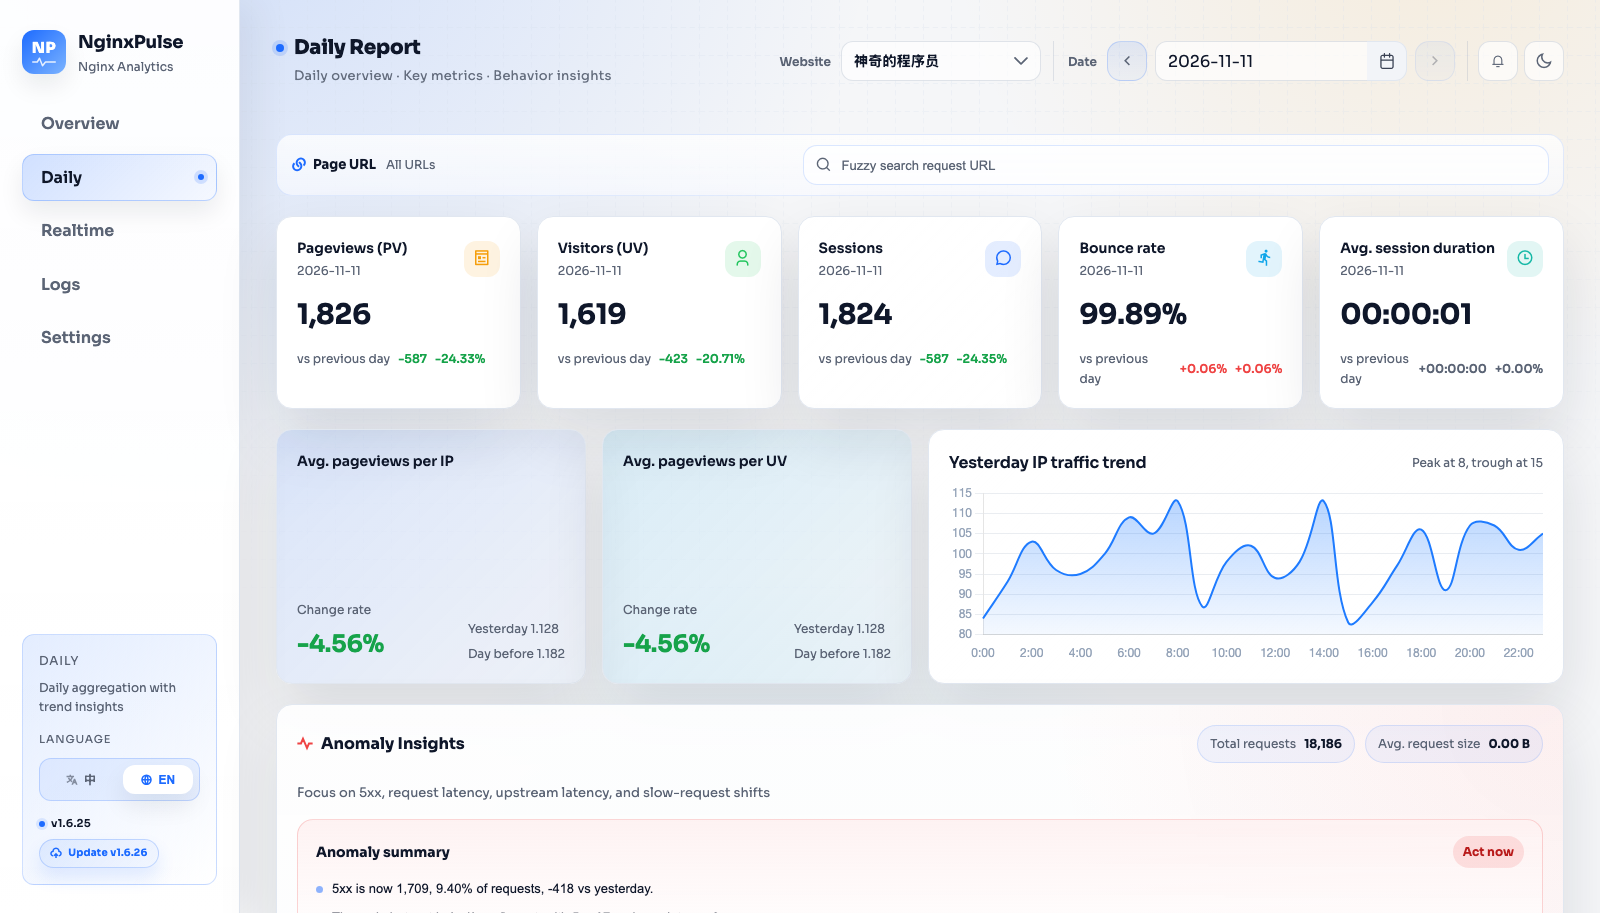
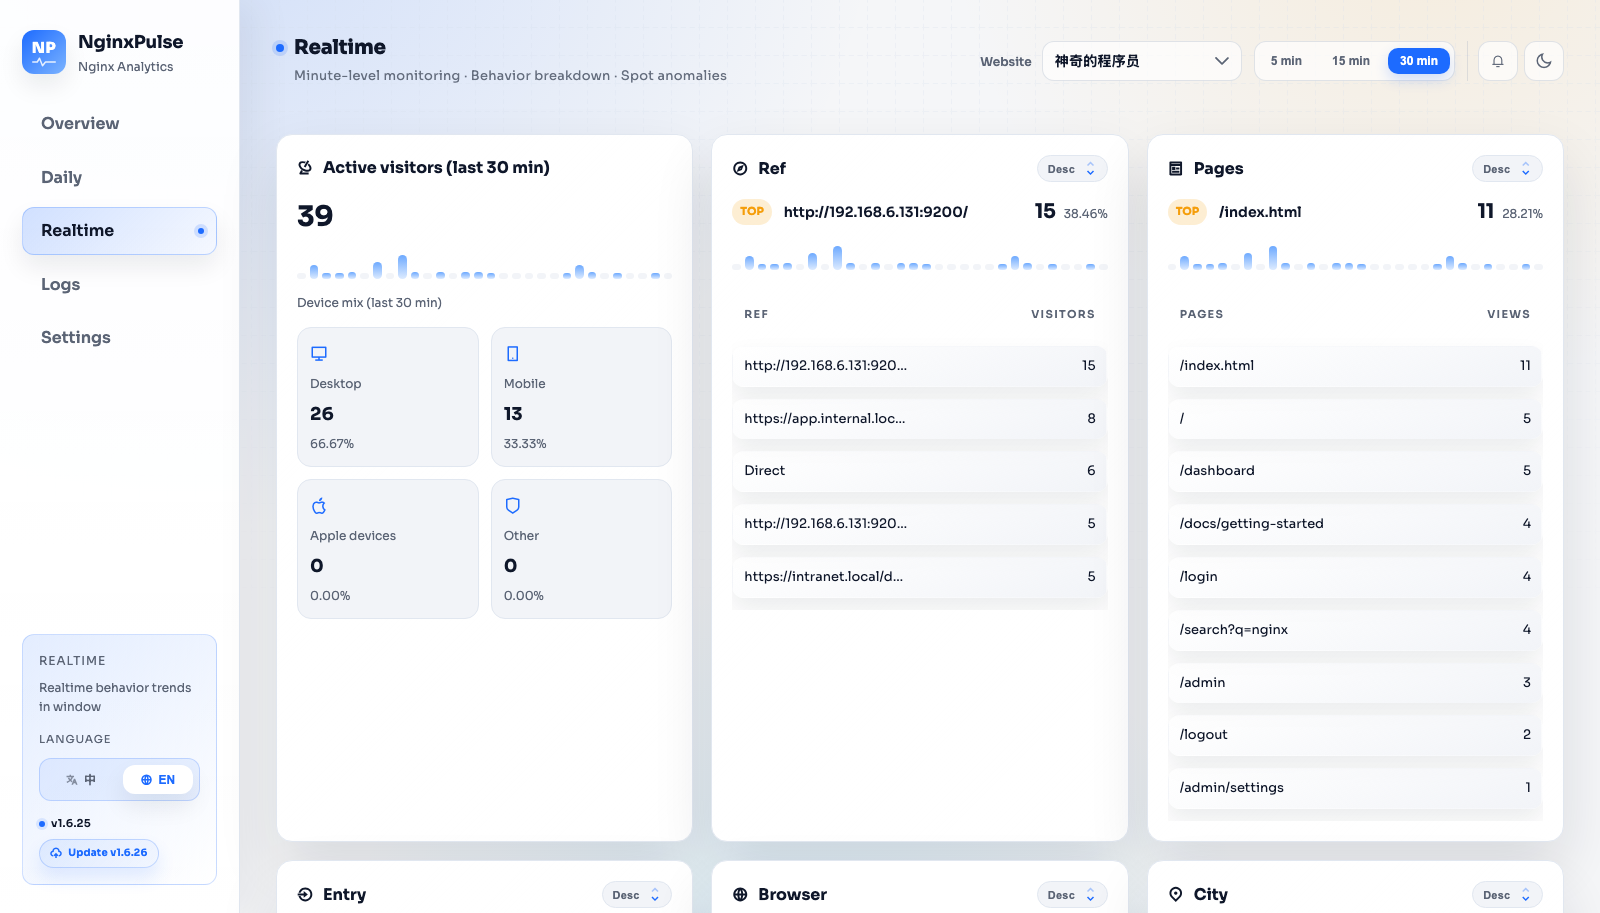
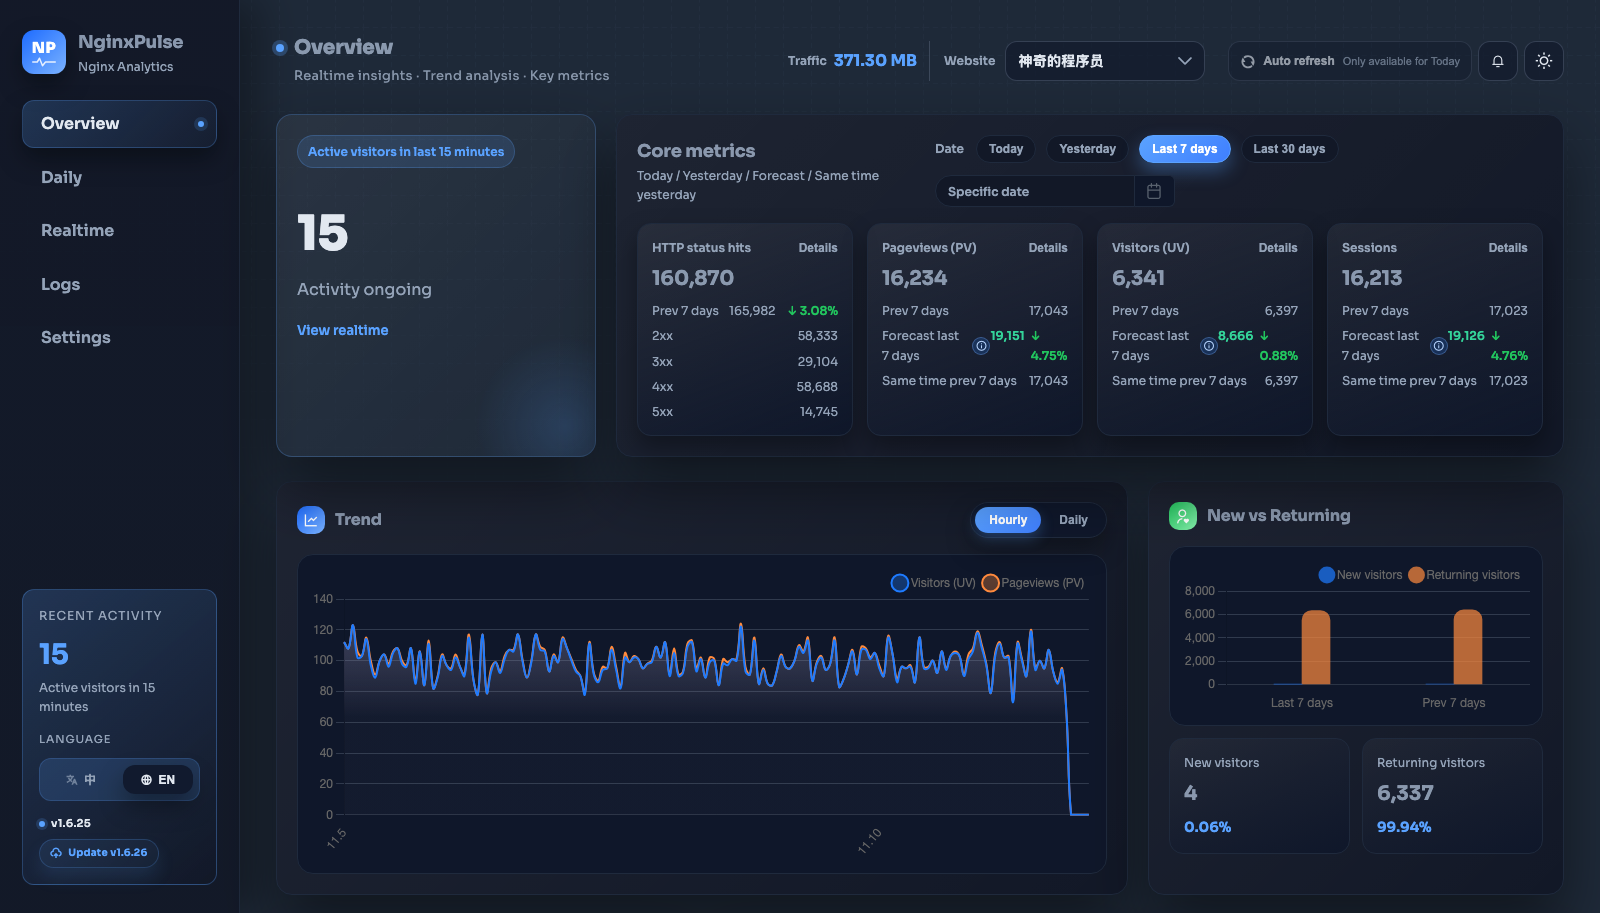
Your web server already keeps a diary of every visitor, and NginxPulse reads it and turns it into dashboards, with no tracking script added to your pages. Point it at an access log and it reports pageviews, unique visitors, sessions, bounce rate, and status code breakdowns, each compared with the previous day or week. A realtime view follows active visitors over the last five, fifteen, or thirty minutes, with device mix, top pages, referrers, browsers, and cities. The daily report adds traffic sources, entry pages, a page URL filter, and an anomaly panel for 5xx errors and slow requests. Logs from Nginx, Caddy, Nginx Proxy Manager, Apache, IIS, HAProxy, Traefik, Envoy, and SafeLine WAF are parsed out of the box, and a custom regex covers anything else. Sources can be local files, rotated or gzipped archives, SFTP, HTTP, S3 buckets, or small push agents running on other machines. A raw log explorer offers search, filters, sorting, export, and reparsing, and a mobile view and dark theme come included. A setup wizard walks you through adding the first site. Self-hosted blogs, homelab reverse proxies, and agencies watching client sites all get privacy-friendly traffic stats from logs they already have. Running on a dedicated VPS on RepoCloud with guaranteed CPU, RAM, and SSD, full root SSH access, and a browser serial console. MIT licensed.
Benefits
- Analytics Without Tracking Scripts
- NginxPulse reads server logs you already have, so visitors never load a tracking script and your pages stay lighter, faster, and more private for everyone who visits.
- Covers Many Web Servers
- Built-in parsers handle Nginx, Caddy, Apache, IIS, HAProxy, Traefik, Envoy, and WAF logs, so one dashboard can follow a mixed fleet of proxies and servers.
- Collect Logs From Anywhere
- Read local or gzipped files, pull over SFTP, HTTP, or S3, or push from remote machines with an agent, so logs never need to be moved by hand.
- From Traffic Dip To Failing URL
- Realtime views, daily reports, and an anomaly panel for 5xx errors and slow requests help you trace a traffic drop to the endpoint that caused it.
Features
- Realtime Visitor View
- Watch active visitors over the last 5, 15, or 30 minutes, with device mix, top pages, referrers, entry pages, browsers, and cities updating as logs arrive.
- Daily Traffic Reports
- Review pageviews, visitors, sessions, bounce rate, session duration, and traffic sources for any date, with day-over-day comparisons and a page URL filter.
- Anomaly Insights Panel
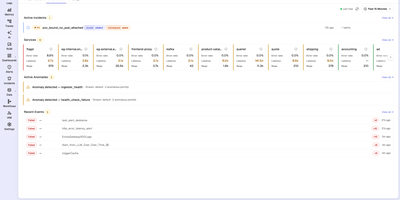
- Track 5xx and 4xx responses, latency, and a ranked list of problem URLs across a seven-day trend to spot failing endpoints early.
- Searchable Log Explorer
- Search raw requests, filter by status code and date range, sort and page through results, export them, and reparse logs after changing configuration.
- IP Geolocation Lookup
- Resolve visitor locations with a bundled IPv4 and IPv6 database, add optional remote batch lookups, or point the dashboard at your own lookup service.
- Mobile And Dark Themes
- Open a compact mobile view for overview, daily, realtime, and log pages, and switch the whole dashboard between light and dark themes.