Sentry
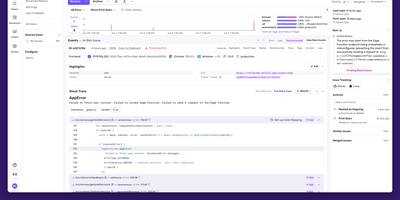
Backed by 44,000 GitHub stars and trusted by over four million developers, Sentry is the debugging platform that captures errors, traces, replays, profiles, and metrics from your applications and connects them all through distributed tracing. The error tracking engine captures full stack traces with source context, breadcrumbs, and automatic demangling for native crashes, while intelligent grouping consolidates duplicate events into actionable issues with regression detection and automatic assignment. Performance monitoring instruments your frameworks automatically, capturing every database query, API call, cache hit, and queue operation as spans within distributed traces that flow across frontend, backend, and mobile boundaries. Session Replay produces video-like recordings of real user sessions showing DOM interactions, network requests, console messages, and errors on a synchronized timeline, with AI-powered summaries that describe what happened without watching the full replay. Continuous profiling captures CPU execution data at the function and line level for Node.js, Python, iOS, and Android, linking slow spans directly to the exact code responsible. Cron monitoring tracks scheduled jobs for failures, missed runs, and duration anomalies. The alerting engine fires notifications through Slack, PagerDuty, Opsgenie, and webhooks on new issues, regressions, error spikes, or when latency and crash-free session rate thresholds are crossed. Self-hosted deployment runs as a Docker Compose stack with PostgreSQL, ClickHouse, Kafka, Redis, and Relay. Running on a dedicated VPS on RepoCloud with guaranteed CPU, RAM, and SSD, full root SSH access, and a browser serial console. FSL licensed.
OpenReplay
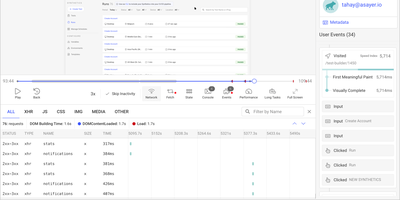
Backed by 12,400+ GitHub stars and positioned as the self-hosted alternative to FullStory and Hotjar, OpenReplay delivers the open-source session replay platform that keeps every byte of user behavior data on your own infrastructure. The JavaScript tracker captures pixel-perfect recordings of clicks, scrolls, form inputs, and navigation with automatic sensitive data masking, while simultaneously logging network requests, console errors, JavaScript exceptions, and Redux, VueX, MobX, NgRx, Pinia, and Zustand store state changes for complete technical context. DevTools mode reconstructs each session with full stack traces, GraphQL queries from Apollo and Relay, Fetch and Axios request payloads, CPU and memory metrics, and page speed waterfall charts — effectively giving developers a browser inspector tied to any user session. Product analytics surfaces conversion funnels, user journeys, click heatmaps, web vitals trends, and retention cohorts without requiring custom instrumentation. Co-browsing connects support agents to live user sessions with cursor control and WebRTC audio, enabling real-time assistance without third-party screen-sharing software. Integrations push session context into Sentry, Datadog, CloudWatch, Stackdriver, and Elastic for front-to-back debugging. Feature flags enable gradual rollouts with session-level targeting. The platform deploys to any cloud via Docker and Kubernetes with auto-scaling ingestion handling up to 50,000 sessions per month on the open-source edition. Running on a dedicated VPS on RepoCloud with guaranteed CPU, RAM, and SSD, full root SSH access, and a browser serial console. AGPLv3 licensed.
Percona PMM
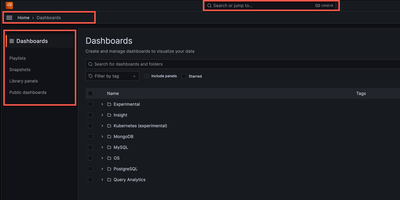
Backed by 1,080+ GitHub stars and maintained by Percona with the latest release v3.8.1 in June 2026, Percona Monitoring and Management delivers the open-source database observability platform that provides a single pane of glass across MySQL, PostgreSQL, MongoDB, Valkey, and Redis databases deployed on-premises, cloud, or hybrid environments. The Go-powered PMM Server collects metrics from lightweight PMM Client agents with minimal performance impact, storing time-series data in ClickHouse for fast querying across configurable retention periods. Query Analytics ranks every query by load across all database engines from one unified dashboard, drilling from fleet-level performance down to individual problematic queries with explain plans, per-query metrics, and anomaly detection. Real-time Query Analytics streams live MongoDB operations updated every 1-5 seconds for immediate troubleshooting of lock contention and long-running queries. Built-in Percona Advisors continuously scan connected databases for security gaps, misconfigurations, and performance problems, distilling decades of DBA expertise into automated actionable recommendations. Percona Alerting integrates with 15+ notification channels including Slack, PagerDuty, email, and webhooks to trigger on custom metric thresholds. Database-specific dashboards visualize InnoDB storage engine details, WiredTiger cache metrics, PostgreSQL tuple activity, replication lag, and cluster health with annotations for root-cause correlation. Deployment options include Docker single-container setup, Podman rootless execution, and Helm charts for Kubernetes with Ingress controller support and ConfigMap management. Running on a dedicated VPS on RepoCloud with guaranteed CPU, RAM, and SSD, full root SSH access, and a browser serial console. AGPL-3.0 licensed.