Stars
Forks
Watchers
Developer links
Parse DMARC
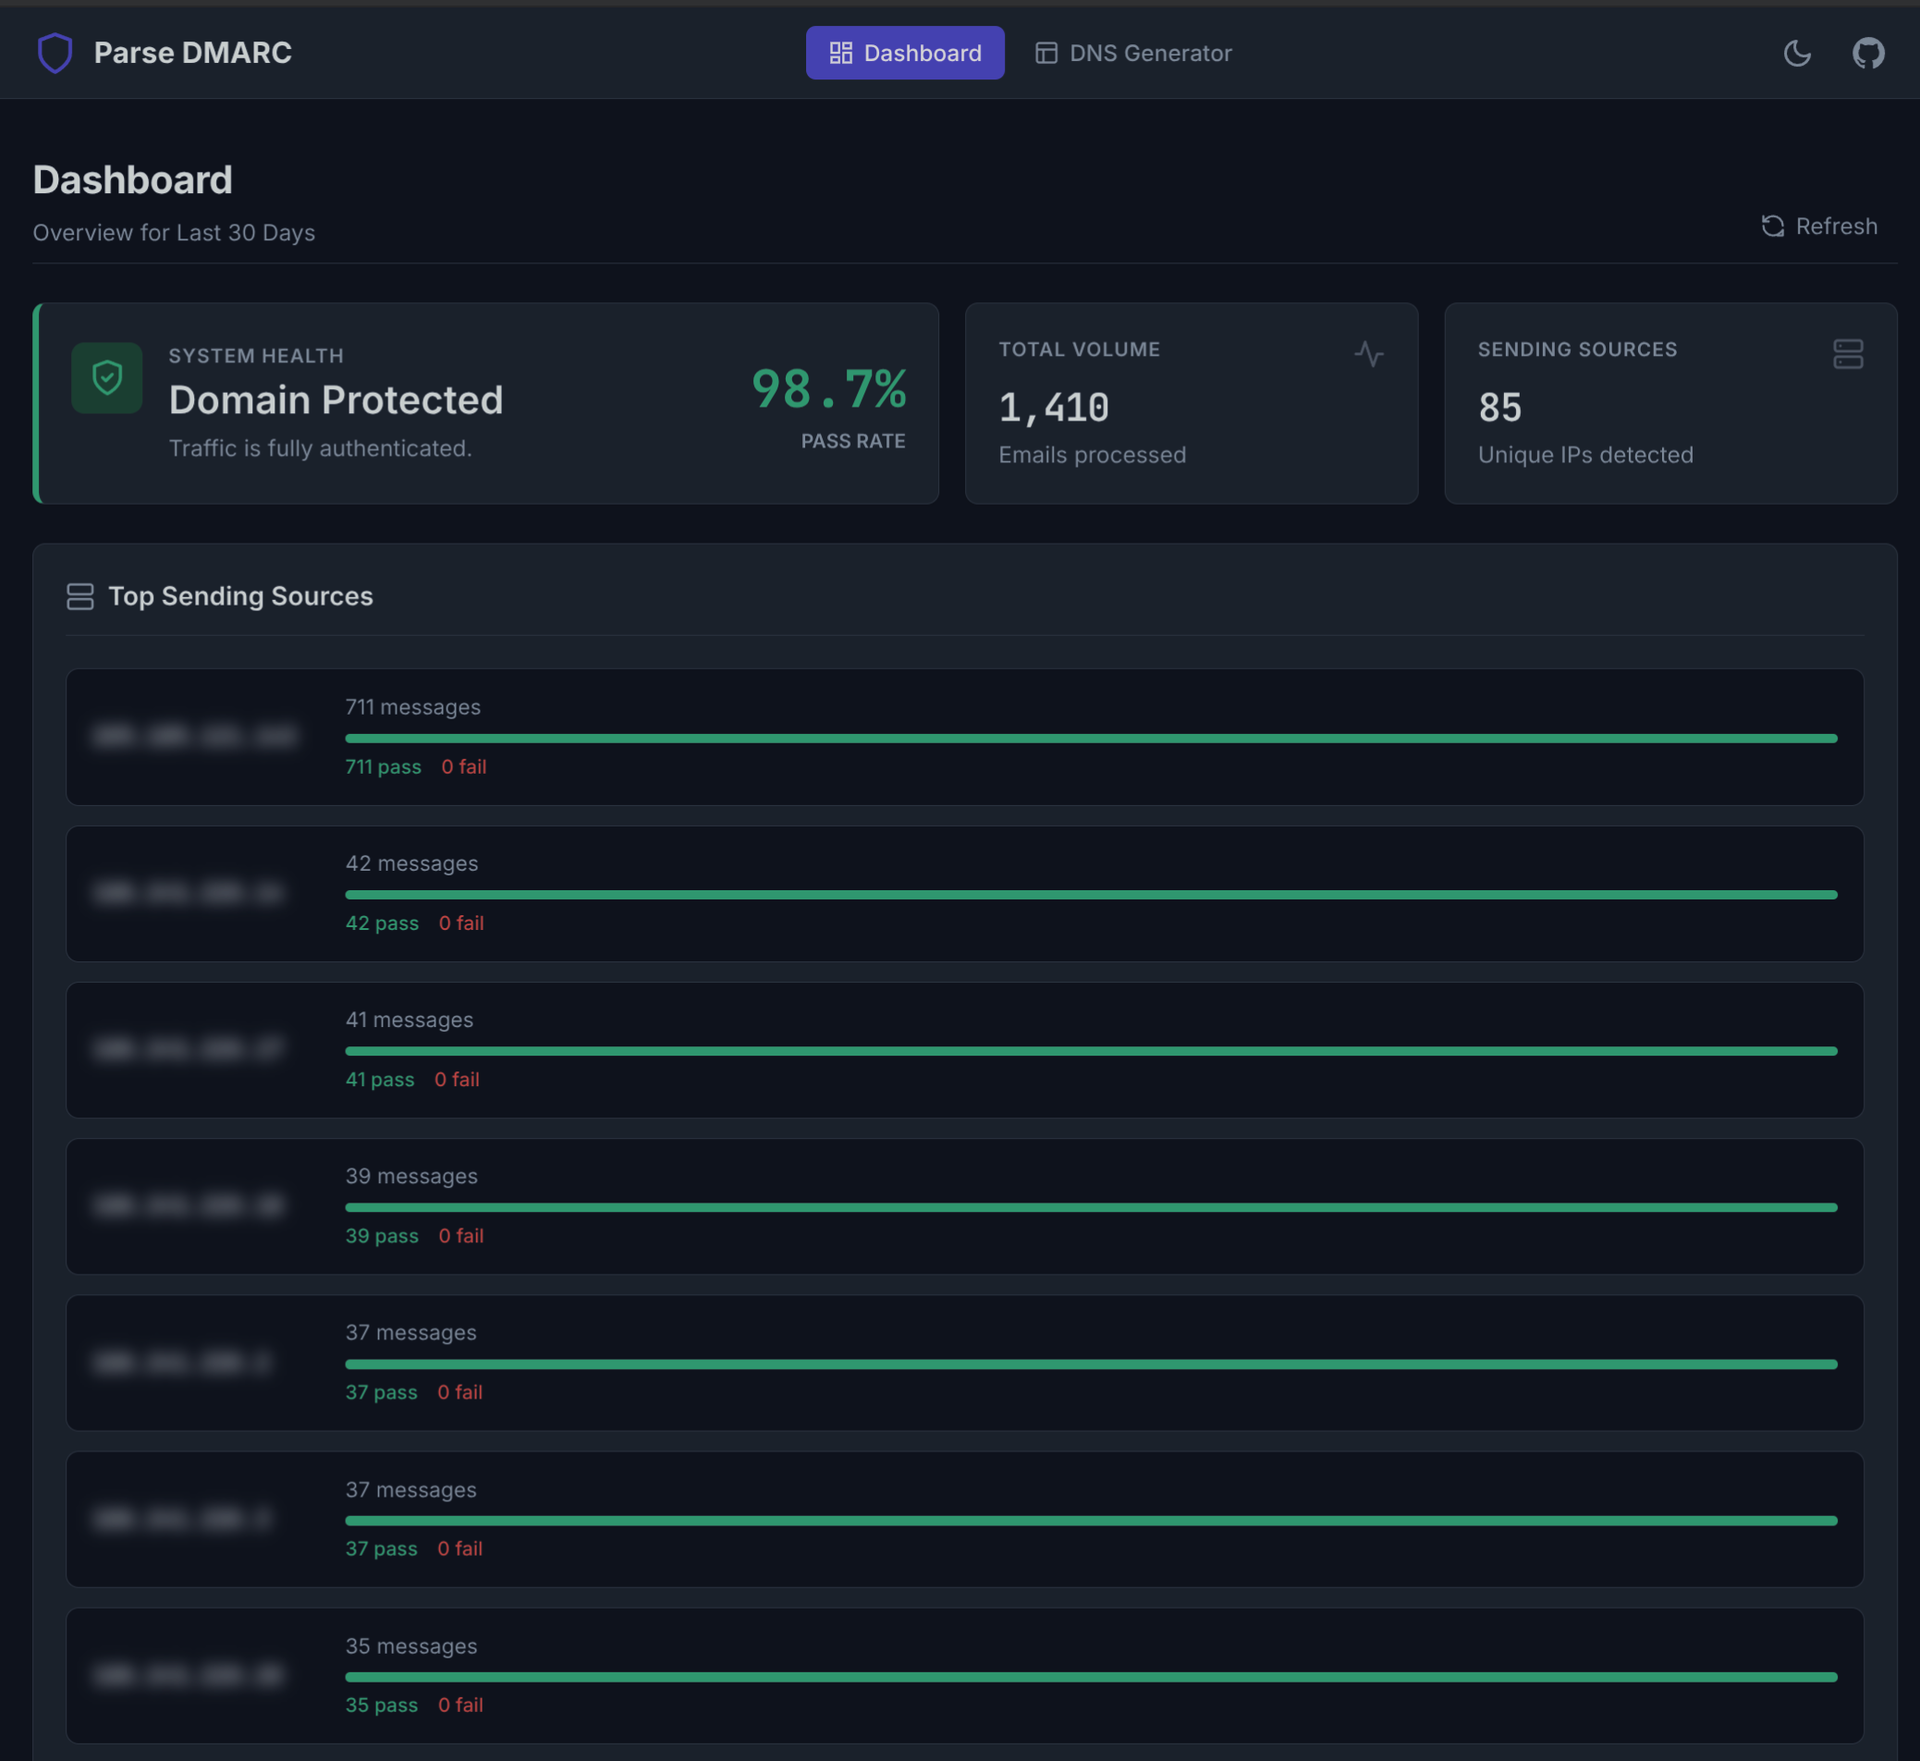
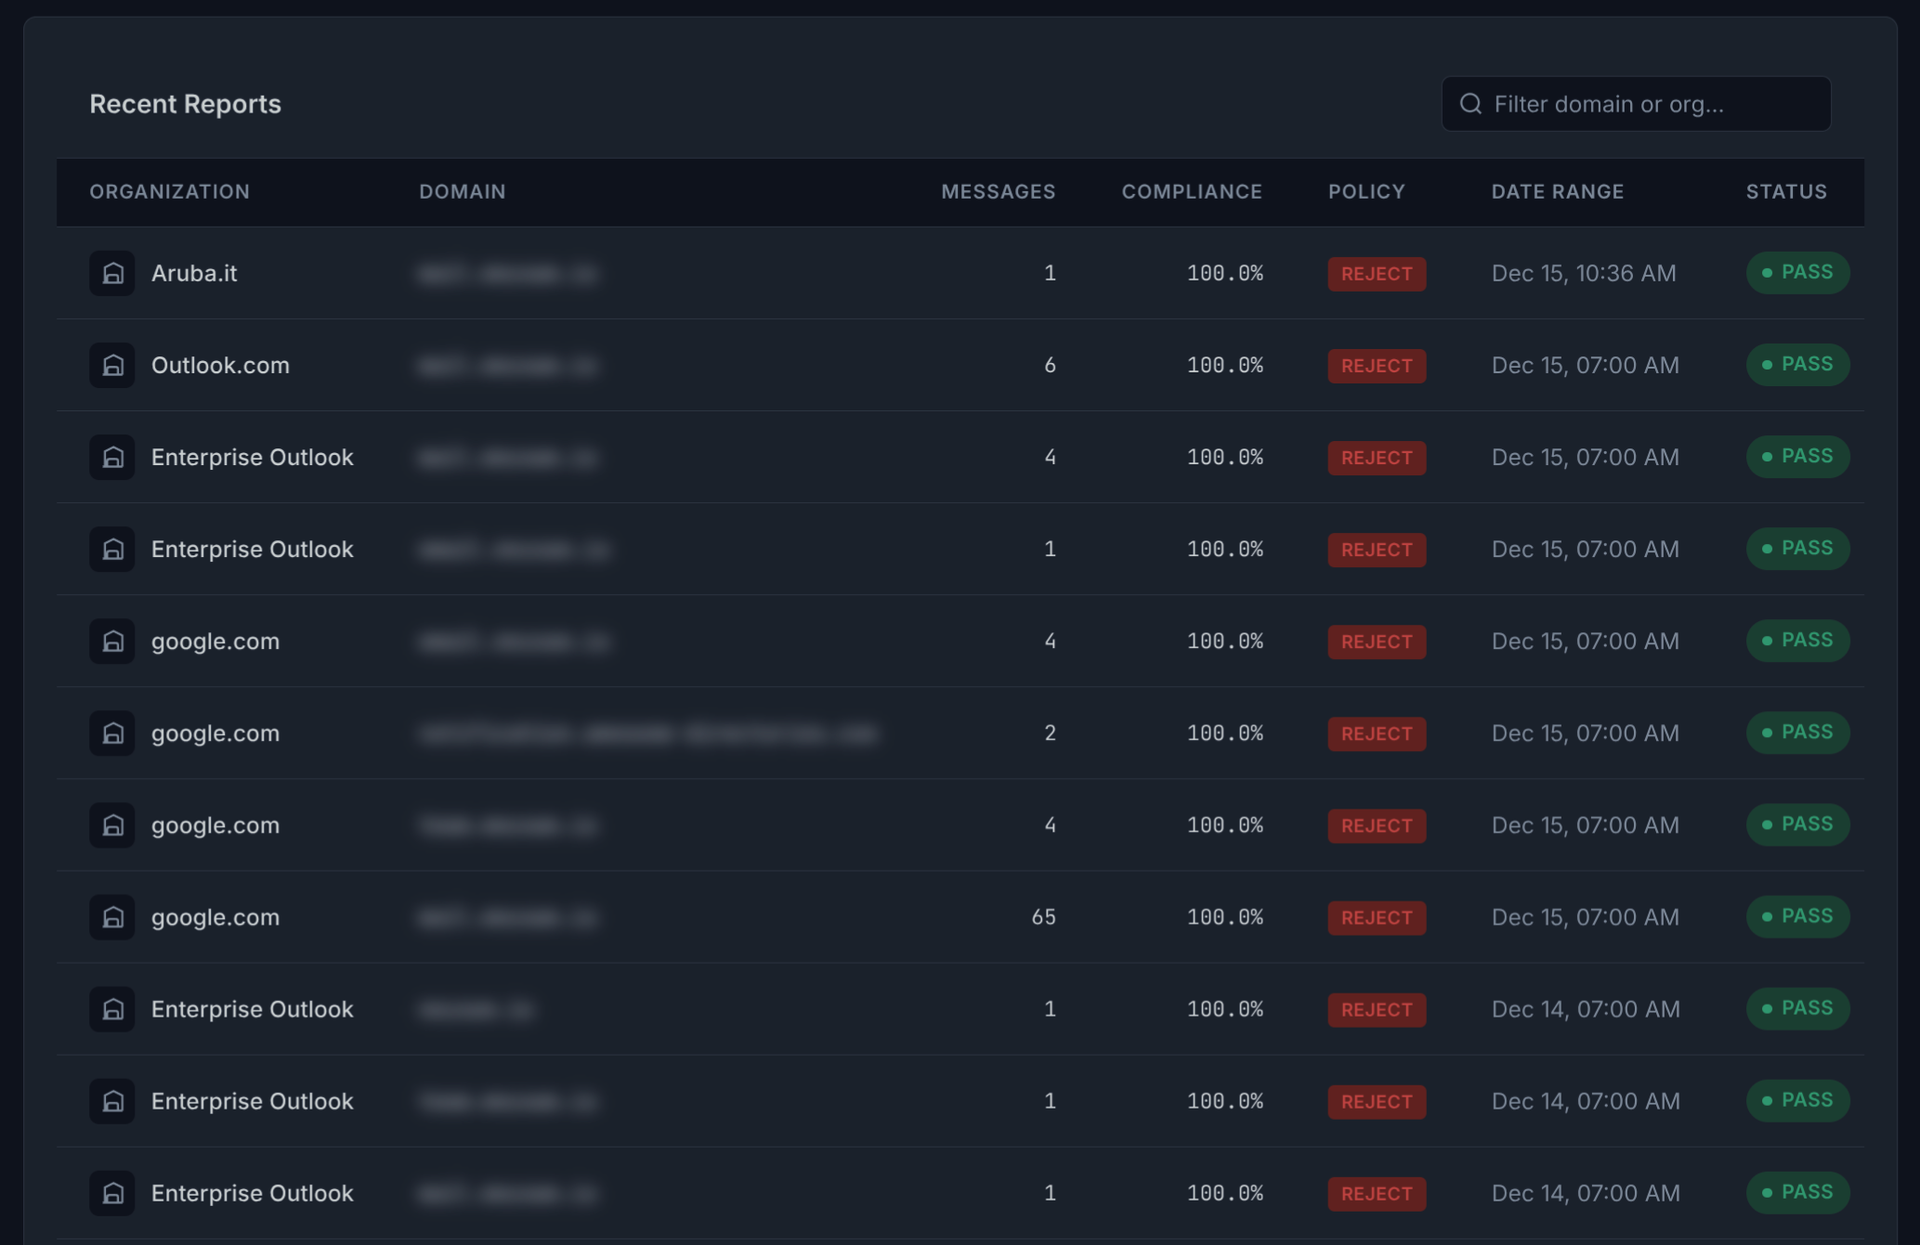
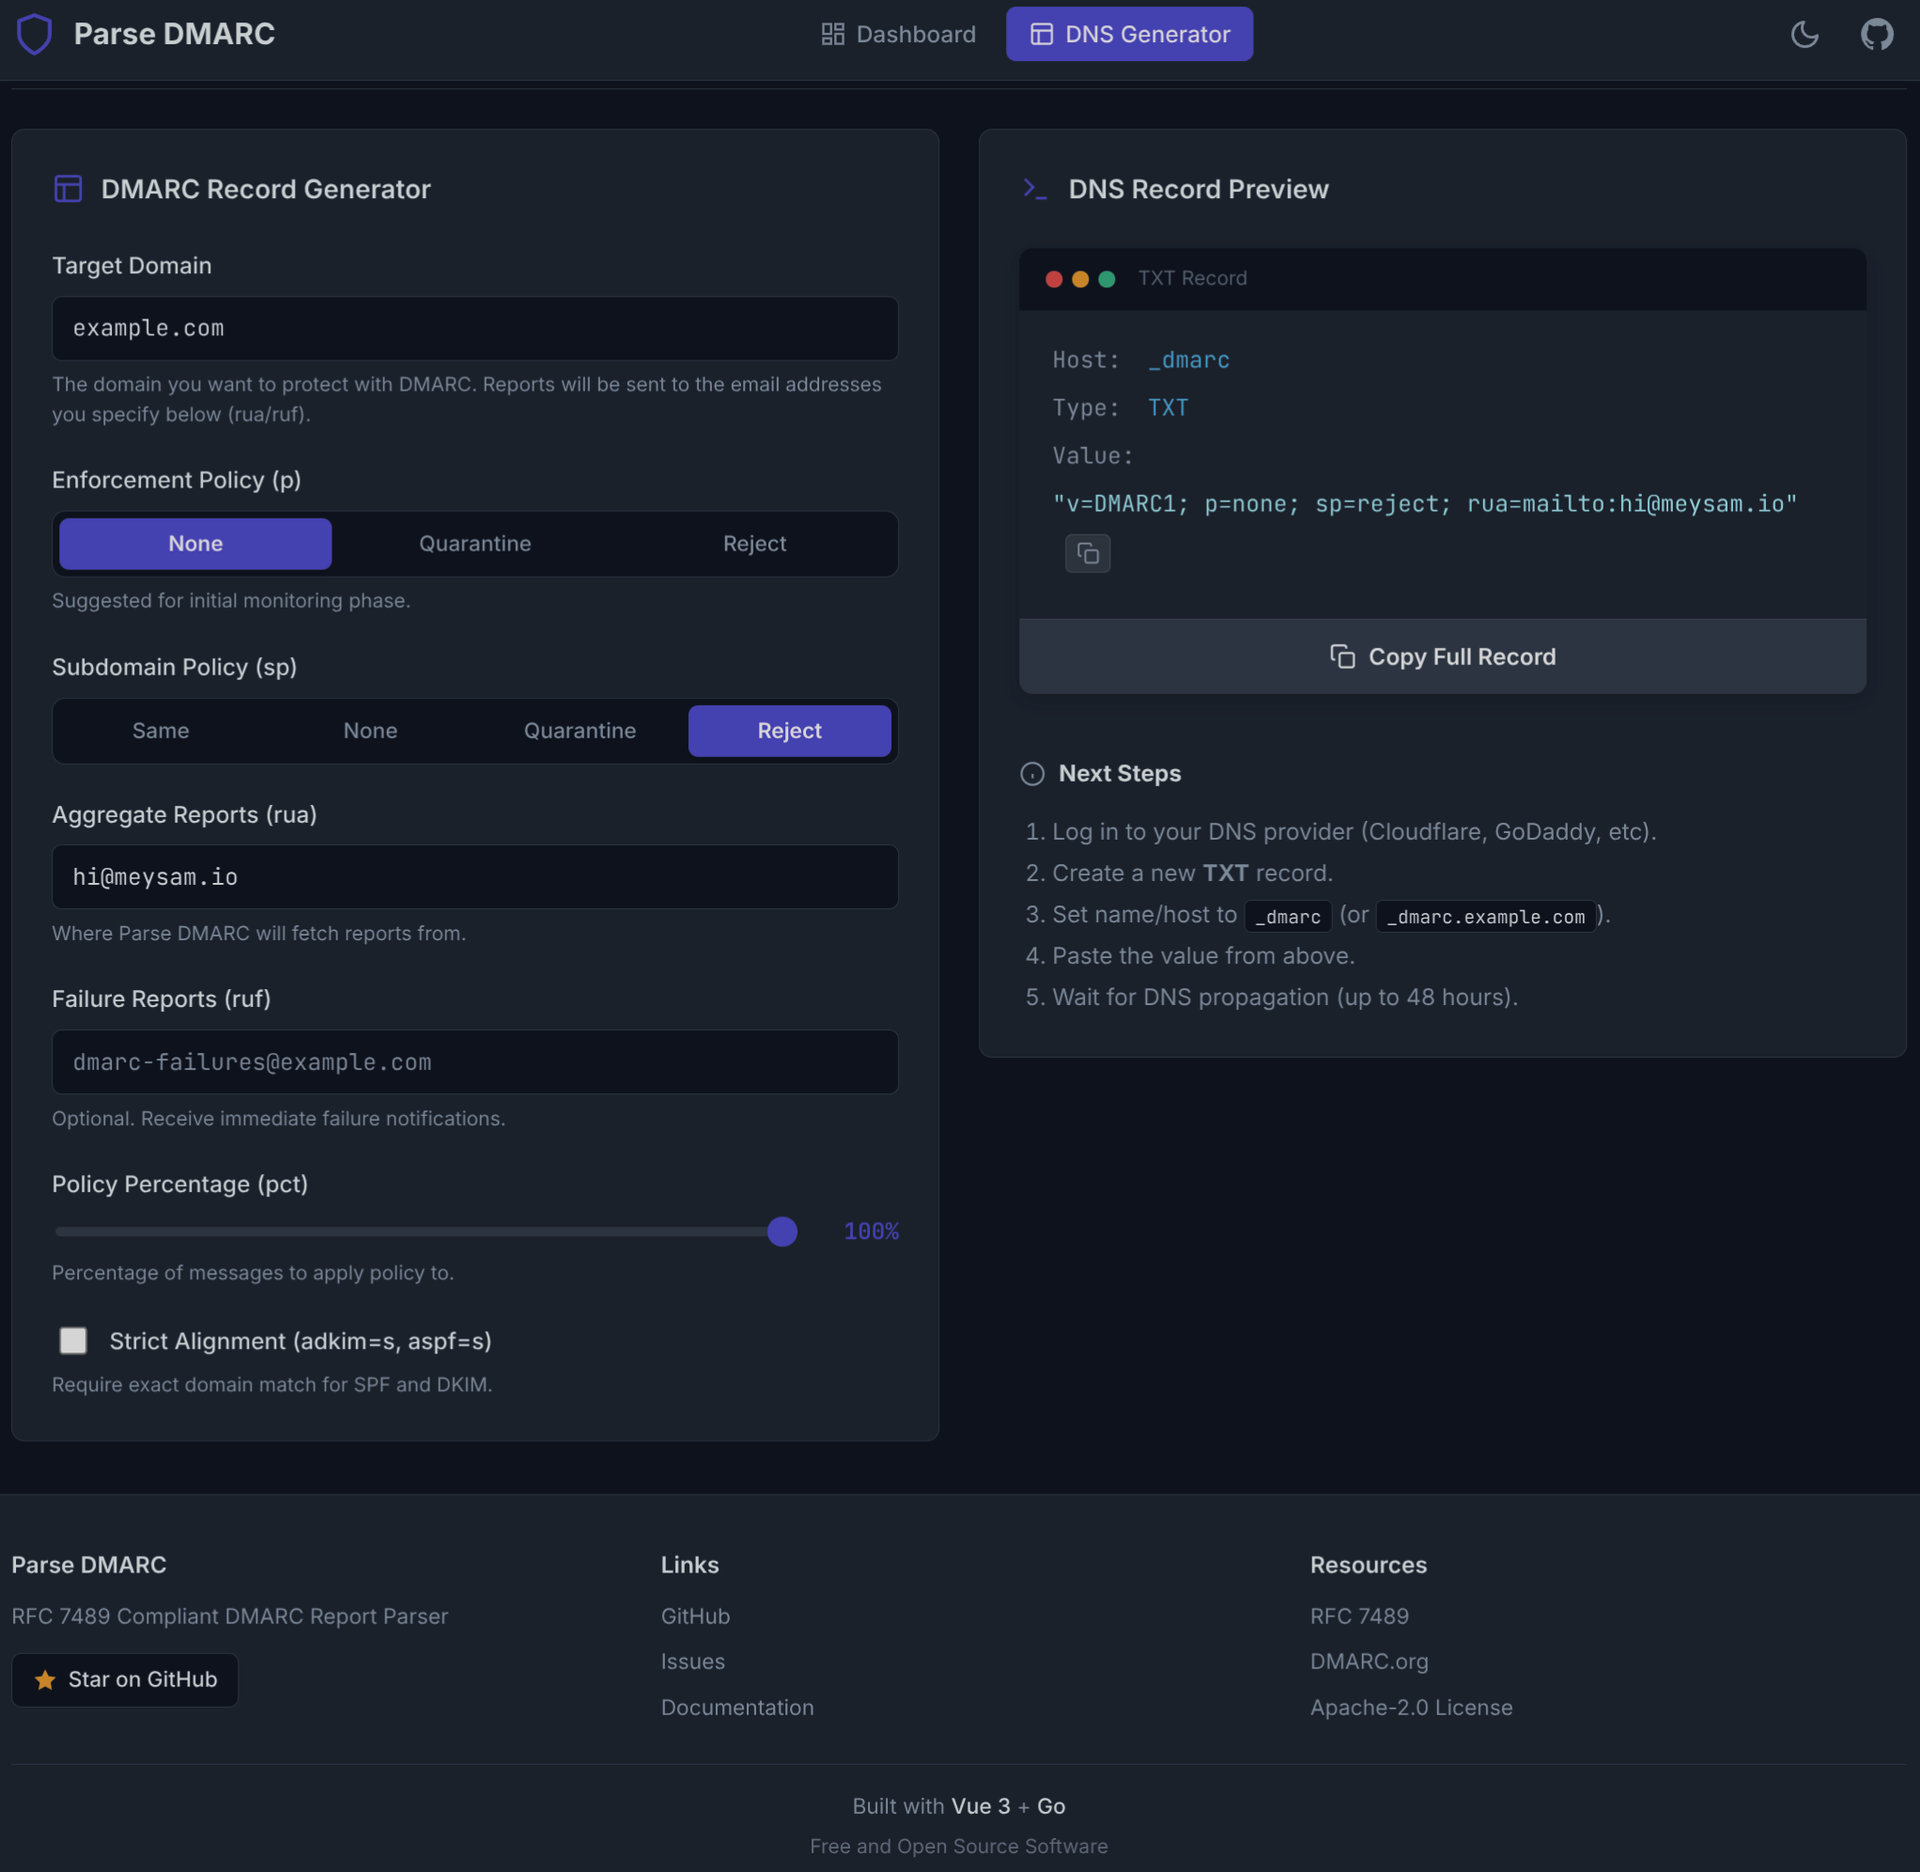
Parse DMARC reads the DMARC aggregate reports that Google, Microsoft, and Yahoo email about your domain every day and shows you, in one dashboard, who is sending mail as you and whether it passes authentication. It fetches the reports over IMAP, unpacks the gzip, zip, and XML attachments automatically, and charts your pass rate, message volume, and top sending sources at a glance. Any report opens down to its raw records, so when an unfamiliar IP starts sending as you, the evidence is one click away instead of buried in XML. Reports forwarded through Exchange or Outlook as message attachments are unwrapped too, and a local Maildir intake covers servers where the mailbox lives on the same host. A built-in generator writes your _dmarc TXT record from a form, so tightening your policy does not mean hand-writing DNS syntax from memory. Twenty-eight Prometheus metrics and a shipped Grafana dashboard move the same data into the monitoring stack you already run. An MCP server lets an AI assistant query your reports directly, asking which sources failed DKIM this week in plain language. Everything stores in a single SQLite file inside one static Go binary, with dark mode for late-night incident reviews. Running on a dedicated VPS on RepoCloud with guaranteed CPU, RAM, and SSD, full root SSH access, and a browser serial console. Apache-2.0 licensed.
Benefits
- Unread Reports Become Answers
- Aggregate reports that normally rot in a mailbox become pass rates, message volumes, and top sending sources, with every report drillable down to its raw records when an unfamiliar sender appears.
- One Binary, One File
- A single static Go binary stores everything in one SQLite file, so there is no database server, no JVM, and no Elasticsearch cluster to babysit for a reporting job.
- Spoofing Shows Up Early
- Daily reports from Google, Microsoft, and Yahoo reveal which IPs send as your domain and whether SPF and DKIM passed, catching spoofers and misconfigured services before users report phishing.
- Metrics And AI Access Included
- Twenty-eight Prometheus metrics with a ready Grafana dashboard feed your existing monitoring, and the built-in MCP server lets an AI assistant answer questions about your reports conversationally.
Features
- IMAP And Maildir Intake
- Fetches reports from any IMAP mailbox or a local Maildir on the same host, parsing gzip, zip, and raw XML with a 16 MB decompression cap per report.
- Dashboard With Raw Records
- Pass rate, message volume, and top sending sources summarize every domain, and any aggregate report opens down to its individual raw authentication records for investigation.
- DMARC Record Generator
- A form-based generator produces your _dmarc TXT record, so publishing or tightening a policy takes minutes instead of hand-writing DNS syntax and hoping the tags are right.
- Prometheus And Grafana Ready
- Twenty-eight Prometheus metrics expose report flow and authentication results, with a shipped Grafana dashboard, while an MCP server lets AI assistants query the same data.