Categories
Monitoring Data Visualization Logging Incident Management Metrics Alerting Operational Dashboards Tracing Traces Logs Performance TestingStars
Forks
Watchers
Developer links
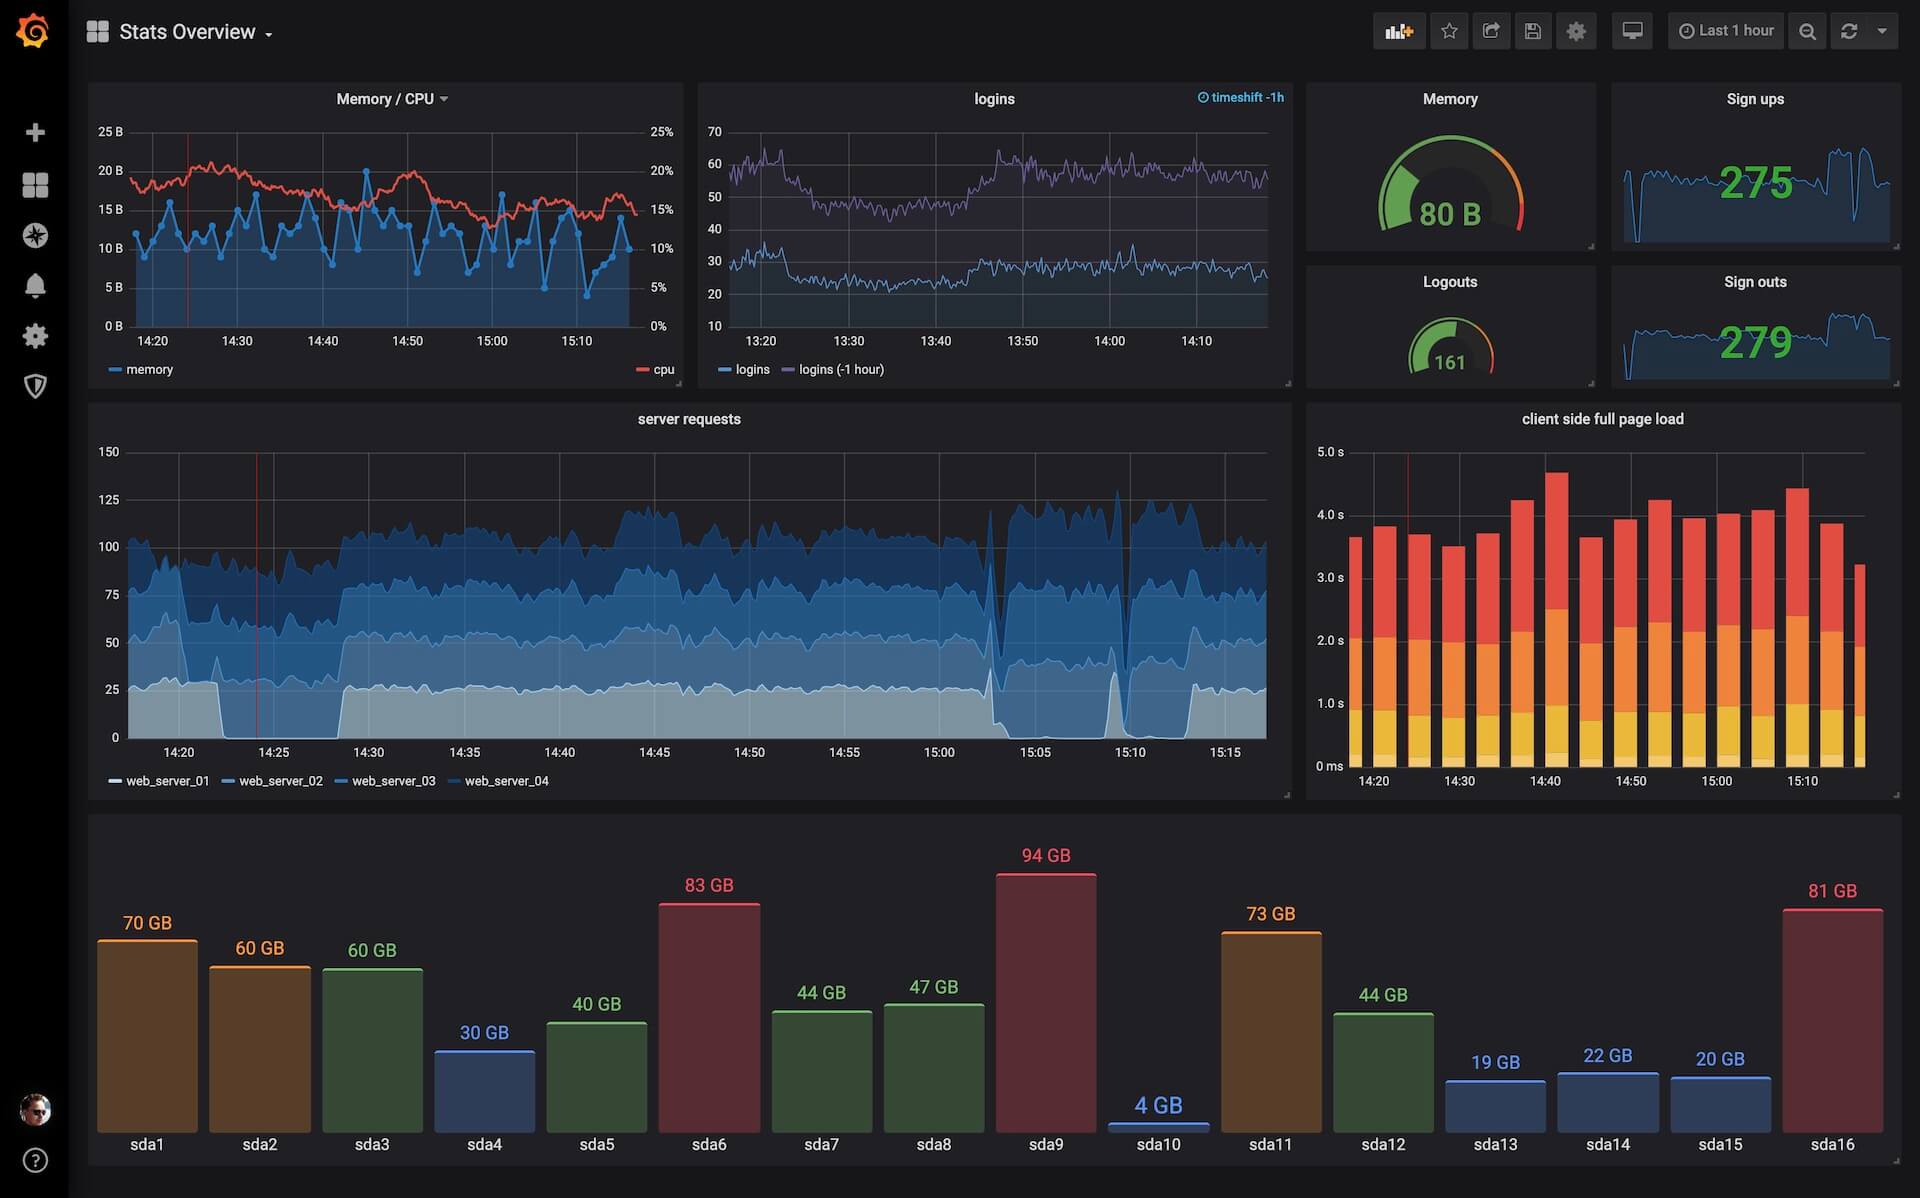
Grafana
Unleash the power of your data with Grafana, the open-source superhero of data visualization! Dive into a sea of metrics, logs, and traces with a platform that's more insightful than a crystal ball. Grafana lets you query like a pro, visualize like an artist, and set alerts like a personal data butler. With its ability to perform high-scale distributed tracing and deliver metrics faster than a cheetah on a skateboard, you'll be the master of incident response, performance testing, and on-call management. Connect to a smorgasbord of data sources and whip up operational dashboards that can make your data sing and dance. And guess what? RepoCloud hosts this gem at a price that won't make your wallet weep. With a free forever plan that's more generous than your grandma, you get to monitor a treasure trove of data with 10,000 series metrics, 50 GB of logs, 50 GB of traces, and 500 VUh of k6 testing. Grafana isn't just a tool; it's your data's new best friend!
Benefits
- Comprehensive Data Visualization
- Grafana provides a powerful platform for visualizing your data, making it easy to understand and analyze. It supports a wide range of data sources, allowing you to bring together all your data in one place.
- Effective Incident Response & Management
- With Grafana Alerting, Grafana Incident, and Grafana OnCall, you can effectively manage incidents and respond quickly to issues. This ensures that your systems remain up and running, minimizing downtime and disruption.
- Performance Testing
- Grafana k6 allows you to conduct performance testing, ensuring that your systems are capable of handling the demands placed on them. This helps to prevent issues before they occur, improving the reliability of your systems.
Features
- Grafana Loki
- A multi-tenant log aggregation system that allows you to easily manage and analyze your logs.
- Grafana Tempo
- A high-scale distributed tracing backend that provides detailed insights into your systems.
- Grafana Mimir
- A scalable and performant metrics backend that allows you to effectively monitor your systems.
- Grafana OnCall
- An on-call management feature that ensures you can quickly respond to incidents and issues.
- Grafana k6
- A load testing tool for engineering teams that helps ensure your systems can handle the demands placed on them.
- Prometheus
- A powerful tool for monitoring Kubernetes and cloud native systems, providing detailed insights and metrics.