Airbroke
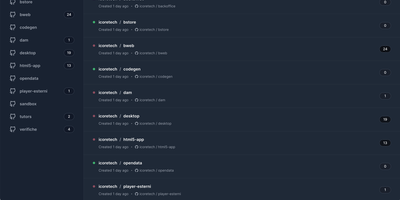
Engineering teams use Airbroke to catch application exceptions in one self-hosted error tracker where they can triage issues, replay failing requests, and debug without a per-event bill. Your existing Airbrake or Sentry clients point at its compatible HTTP collector endpoints, so instrumented applications keep reporting with no new SDK to adopt, and every occurrence lands in storage where the footprint stays small even under heavy ingestion. The web interface groups errors into issues you can triage, bookmark important occurrences for follow-up, and read occurrence charts that show whether a bug is a one-off or a slow-building wave. When an HTTP exception looks suspicious, you can replay the original request directly or copy a generated cURL command that reproduces it exactly, turning vague log complaints into debuggable cases. An AI assistant answers questions about issues in context, an MCP API lets LLM agents query your error data programmatically, and multiple OAuth providers secure sign-in for the team. It runs as a small service needing only a database, a single core, and a few hundred megabytes of memory. Running on a dedicated VPS on RepoCloud with guaranteed CPU, RAM, and SSD, full root SSH access, and a browser serial console. MIT licensed.
ServerBee
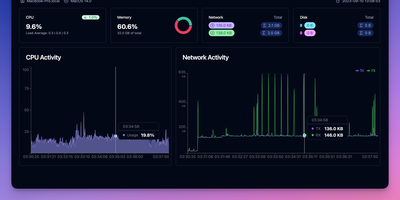
ServerBee delivers complete fleet monitoring from a single Rust binary that embeds both the server and web UI, requiring no external database or heavy runtime. Lightweight agents installed on each node stream CPU, memory, disk, network, load, temperature, GPU, and disk I/O metrics over persistent WebSocket connections to a central server backed by embedded SQLite. The real-time React dashboard presents 17 drag-and-drop widget types across custom layouts, with historical charts spanning one hour to 30 days and monthly traffic statistics with billing-cycle prediction and cost insights including burn rate and per-resource unit cost scoring. Network monitoring covers ICMP, TCP, and HTTP ping probes, service monitors for SSL certificates, DNS records, HTTP keyword matching, TCP ports, and WHOIS expiration, plus network-quality probing across 96 China 3-ISP and international presets with IP-quality and streaming-unlock detection. Remote management features include a web terminal with sandboxed file manager, Docker container stats with logs and events, firewall configuration, and agent auto-update capabilities. Public status pages display 90-day uptime timelines, while alerting supports email and webhook notifications with flexible trigger expressions. A native iOS companion app provides mobile monitoring access. Deploy via Docker or download the single binary for Linux, macOS, or Windows, running on a dedicated VPS on RepoCloud with guaranteed CPU, RAM, and SSD, full root SSH access, and a browser serial console. AGPL-3.0 licensed.
BorgWarehouse
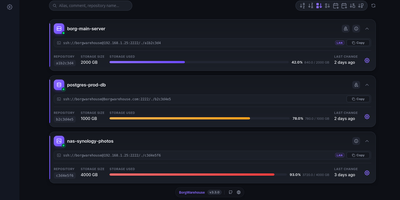
Centralizing BorgBackup usually means hand-creating Unix users, wiring SSH keys, and remembering which machine stopped backing up three weeks ago; BorgWarehouse replaces that terminal work with a dashboard built for exactly this job. Add a repository and it provisions the dedicated user, authorized key, and storage quota for you, then hands back ready-to-paste client commands so a new machine is backing up in minutes. Every repository carries a freshness threshold: when no modification lands within the window you set, its status dot turns red and an alert goes out by SMTP email, through Apprise to Discord, Telegram, Slack, Gotify, or ntfy, or as a signed webhook POST to tools like n8n and Uptime Kuma, rate-limited to one alert per repository per day. Append-only mode is enforced on the server, so even a fully compromised client can add archives but never destroy existing ones, which is the property that keeps ransomware from eating your backup history. The monitoring view tracks storage consumption against each quota, a setup wizard walks new clients through onboarding (with a LAN variant for local transfers), and sign-in can delegate to GitHub, Google, Microsoft, GitLab, or any OIDC provider. A versioned REST API automates provisioning, and your passphrase never reaches the server: backups stay end-to-end encrypted on the clients. Running on a dedicated VPS on RepoCloud with guaranteed CPU, RAM, and SSD, full root SSH access, and a browser serial console. AGPL-3.0 licensed.
Workbench
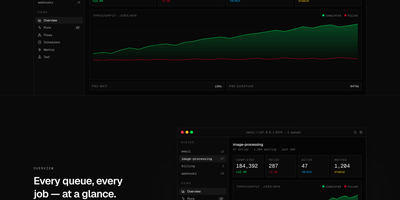
For teams running BullMQ, Workbench makes the inside of your job system visible, searchable, and fixable from a single browser dashboard. Live counters track completed, failed, active, and waiting jobs per queue alongside p50 and p95 latency and throughput, so a backing-up queue announces itself before your users do. Every run sits in a filterable table where you can expand the full payload and attempt history, retry with a keystroke, or click a line in a failed job's stack trace and land on that exact file in your editor. Failures are grouped by error class and ranked by frequency with a 24-hour trend, which makes a fresh regression obvious the moment it spikes. Parent and child jobs render as a real graph you can drill into and replay subtree by subtree, schedulers can be paused or edited without a redeploy, and new jobs can be enqueued from a form that validates the payload first. Running on a dedicated VPS on RepoCloud with guaranteed CPU, RAM, and SSD, full root SSH access, and a browser serial console. MIT licensed.
Nezha Monitoring
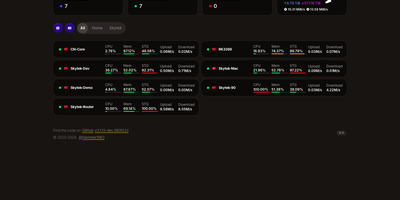
Keep every VPS, home-lab box, NAS, and router you run on one self-hosted dashboard, with a small agent on each machine reporting whether it is up and how hard it is working. Nezha tracks CPU, memory, swap, disk, load, traffic, process counts, and TCP and UDP connections on Linux, Windows, macOS, OpenWRT, and Synology machines, plus GPU and temperature where supported. Servers sort into groups and appear as cards, a list, or a world map, with live charts and, when the optional time-series database is on, 1, 7, and 30 days of history. HTTP GET, ICMP Ping, and TCPing monitors run from the servers you choose, chart latency and packet loss, and warn about HTTPS certificate changes and upcoming expiry. Alert rules watch offline servers, resource use, bandwidth, and cycle traffic limits, then message Telegram, Slack, Matrix, Feishu, DingTalk, or any webhook. A browser terminal and file manager handle quick fixes, while scheduled or alert-triggered tasks run backups, restarts, and scripts across many servers. DDNS updates Cloudflare, Tencent Cloud, or Hurricane Electric records when an agent's IP changes, and NAT traversal publishes a home router or NAS page on your own domain. Admin and user roles, scoped API tokens, and an optional MCP endpoint let people and AI tools list servers and run commands within their permissions. Running on a dedicated VPS on RepoCloud with guaranteed CPU, RAM, and SSD, full root SSH access, and a browser serial console. Apache-2.0 licensed.
Lab Dash
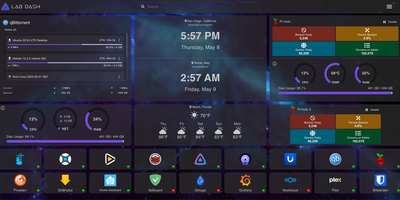
Every homelab deserves a control center that looks as good as the services it manages. Lab Dash gives you a customizable, drag-and-drop dashboard where every tile earns its spot. Add shortcut widgets linking to your Plex, Grafana, Nextcloud, or any service with automatic health check indicators showing green or red status at a glance. The system monitoring widget displays real-time CPU usage, memory consumption, network throughput, disk utilization, and temperature readings by mounting the host /sys directory as a read-only volume. Integrate Pi-hole stats, qBittorrent download progress, and media server widgets for Jellyfin, Plex, or Emby directly on your grid. Multiple pages let you organize services by category, and the search bar finds any tile instantly. Customize the background image from a local upload or URL, set a custom title and tab name, and choose your preferred search provider including self-hosted options like SearXNG. All sensitive configuration data is encrypted locally with AES-256-CBC, and only administrator accounts can modify the layout. Install Lab Dash as a Progressive Web App on desktop, phone, or tablet for a native app experience with offline capability. Configurations export as backup files for easy migration between instances. On RepoCloud, deploy Lab Dash on a dedicated VPS with root SSH access and Docker socket connectivity under the GPL-3.0 license.
OpenLIT
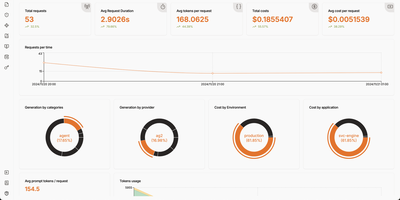
Your AI application is burning through API tokens faster than you can refresh the billing page, and you have no idea which prompt template is responsible. OpenLIT plugs that visibility gap with a self-hosted observability platform built specifically for LLM workloads. Add one line of code to instrument 90+ LLM providers, agent frameworks, and vector databases, then watch every request flow through a tracing dashboard that shows tokens consumed, latency measured, and dollars spent per call, per model, per environment. The requests view lists every LLM interaction with provider, model, cost, and token breakdown in a filterable table, while the trace detail panel lets you drill into individual spans to read the exact prompt sent and response received. Prompt Hub turns prompts into versioned artifacts you deploy, rollback, and A/B test without touching application code. OpenGround compares models side by side on the same input, so you can evaluate cost-versus-quality tradeoffs before committing to a provider. Automated evaluations run LLM-as-a-judge scoring on live production traces, flagging hallucinations, bias, and toxicity in real time. The Vault stores and rotates API keys centrally so secrets stay out of your codebase. Custom dashboards let you build drag-and-drop monitoring views with charts, stat cards, and tables backed by SQL queries against ClickHouse. GPU utilization, memory, temperature, and power metrics feed into the same platform for end-to-end infrastructure visibility. Running on a dedicated VPS on RepoCloud with guaranteed CPU, RAM, and SSD, full root SSH access, and a browser serial console. Apache 2.0 licensed.

Saki Panel
Saki Panel is a self-hosted operations console that manages your game servers, containers, and background processes across multiple Linux machines, with an AI assistant sitting inside the workspace when something breaks. Start, stop, restart, and monitor nine kinds of instances, from Minecraft and Steam game servers to Docker containers, Compose stacks, Node and Python apps, and plain shell commands. Remote nodes connect over SSH and report CPU, memory, and disk metrics to a cluster dashboard, so every machine is visible in one place. When an instance crashes, Saki Watch records the exit and its error fingerprint, then helps diagnose the cause from live logs, files, and metrics instead of making you copy text between a terminal and a chat window. Proposed fixes appear as diffs that need your approval, are graded by risk level, and can roll back automatically if verification fails after a patch. Day to day work happens in the same console: a web terminal, a file manager with an editor and archive support, database tools for SQLite, MySQL, PostgreSQL, and Redis, and cron-scheduled tasks with full run history. Role-based access with dozens of permission codes, audit logs, and incident notifications through webhooks or Telegram keep a small team in control. Running on a dedicated VPS on RepoCloud with guaranteed CPU, RAM, and SSD, full root SSH access, and a browser serial console. Apache-2.0 licensed.
MiBee NVR
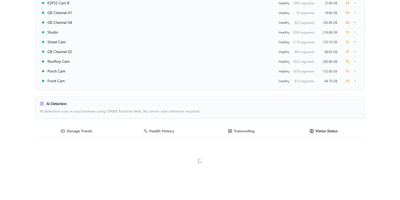
Your cameras should answer to you, not to a vendor cloud, and MiBee NVR turns an ordinary server into a complete video recorder that keeps every frame on your own disks. The surveillance grid shows all cameras live at once with per-camera health scores, while the recordings timeline marks AI-detected events so you can jump straight to the moment that matters instead of scrubbing hours of empty hallway. ONVIF cameras joining the network are discovered and enrolled automatically, and a camera that changes its IP address is relocated by serial number and reconnected without your intervention. Adaptive recording watches the compressed stream and drops calm scenes to a timelapse-grade baseline, cutting disk use by 75 to 98 percent on static views while a pre-buffer guarantees no frames are lost when motion resumes. You can push video in from remote publishers over RTMP, SRT, or WHIP, re-serve every camera as an RTSP feed, and browse the recording library from a TV through DLNA. Browser-side AI detection flags people and motion with no inference server to maintain, and Prometheus metrics with ready-made Grafana dashboards expose per-camera stream and storage health. Running on a dedicated VPS on RepoCloud with guaranteed CPU, RAM, and SSD, full root SSH access, and a browser serial console. AGPL-3.0-only licensed.
OpsKnight
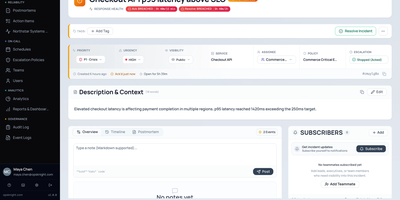
When production breaks at 3 a.m., somebody has to know it is their turn, and OpsKnight keeps that answer on your own server instead of a per-seat subscription. Alerts from Prometheus, Grafana, Datadog, Sentry, CloudWatch, and generic webhooks arrive at authenticated endpoints, get deduplicated, and are routed to the right service. On-call schedules support rotation layers, daylight saving safe handoffs, and temporary overrides, and escalation policies page users, schedules, or whole teams in timed steps. Responders get push, email, SMS, WhatsApp, and Twilio voice calls where the keypad acknowledges the page. Each incident has an ownership panel, a timeline, notes, subscribers, action items, and SLA timers, and Slack or Teams war rooms keep chat in step. The Command Center shows active, muted, and unassigned incidents at a glance, analytics report MTTA, MTTR, and SLA compliance, and a System Health Center runs live diagnostics. A public status page with uptime history, maintenance notices, and subscribers keeps customers informed, and postmortems capture what the team learned. Sign-in supports OIDC and SCIM provisioning, and an installable mobile web app brings pages to your phone. Running on a dedicated VPS on RepoCloud with guaranteed CPU, RAM, and SSD, full root SSH access, and a browser serial console. AGPL-3.0 licensed.
Slurm-web
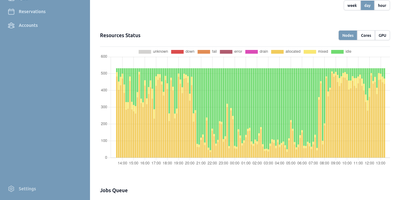
Slurm-web gives HPC cluster operators and users a browser dashboard for watching jobs, nodes, and GPUs across a Slurm cluster instead of living in squeue output. The overview page charts resource and job status with interactive graphs, so a glance tells you whether the machine is busy, idle, or quietly failing. The jobs view filters and sorts instantly, updates live as jobs change state, and uses colored badges so pending, running, and failed work sorts itself out visually at any scale. Node views go deeper: advanced visualizations show node status across racking topology, GPU utilization is tracked alongside CPU resources, and problems surface as highlighted issues rather than a line in a log file. Account trees, quality-of-service settings, and advanced reservations get intuitive graphical views that make fair-share politics legible to everyone involved. Prometheus integration collects and charts timeseries metrics for longer-term capacity questions. Access is enterprise-ready: LDAP and Active Directory authentication, OpenID Connect single sign-on through providers like Keycloak or Authentik, and granular role-based permissions decide who sees which clusters. Several clusters can be monitored from one deployment, the interface supports dark mode and custom branding with your own colors and logos, caching keeps the UI responsive against busy controllers, and integrated help explains each view in place. Running on a dedicated VPS on RepoCloud with guaranteed CPU, RAM, and SSD, full root SSH access, and a browser serial console. MIT licensed.
Lunalytics
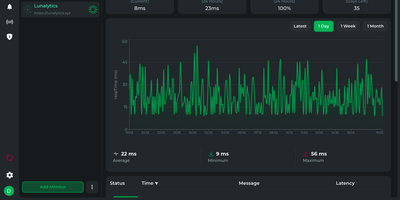
Lunalytics keeps watch over your websites, APIs, servers, and Docker containers, alerts your team the moment something goes down, and gives customers a branded status page to check instead of emailing you. Checks run over HTTP(S), TCP, ping, JSON query, push heartbeat, and Docker container status. Each monitor charts response time for the latest checks, one day, one week, or one month, next to uptime percentages and a certificate expiry countdown. Set a parent on a check and its dependents stop alerting when the parent is already down. The status page builder offers a block-based layout editor, custom colors, fonts, logos, favicons, and light or dark themes. Incident updates carry a timestamp and an impact level like Major Outage. Notifications reach Discord, Slack, Telegram, Pushover, Home Assistant, SMTP email, and webhooks with editable JSON payloads, and Apprise adds more than 100 further services. Teams get role-based access control, single sign-on through Authentik, Authelia, Keycloak, Discord, Google, GitHub, Slack, or Twitch, and personal API keys for scripting. Each user can pick a theme, accent color, time format, and timezone. Running on a dedicated VPS on RepoCloud with guaranteed CPU, RAM, and SSD, full root SSH access, and a browser serial console. AGPL-3.0 licensed.
Coroot
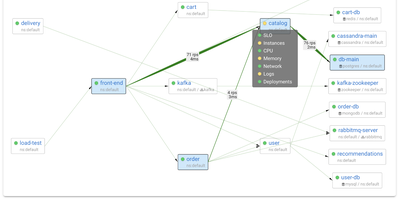
Coroot uses eBPF to capture metrics, distributed traces, logs, and continuous CPU profiles directly from the Linux kernel, delivering full observability without any application code changes, SDKs, or sidecars. From the first minute of deployment, an automatically generated service map covers every microservice, database, message queue, and external dependency with request rate, error rate, and latency measurements. When a service breaches its SLO, AI-powered inspections analyze telemetry across all dimensions to pinpoint the root cause and send a single consolidated alert with findings, replacing the flood of fragmented notifications typical of traditional monitoring. Deployment tracking automatically discovers Kubernetes rollouts and compares each release against the previous one to detect performance regressions, resource spikes, and cost impacts without CI/CD pipeline integration. Continuous profiling captures CPU flame graphs down to the line of code with negligible overhead. Integrated cost monitoring tracks cloud spending across AWS, GCP, and Azure, attributing expenses to individual services and deployments. Coroot supports Prometheus, OpenTelemetry, and ClickHouse as data sources and works identically on Kubernetes clusters, virtual machines, and bare-metal hosts. 7,700+ GitHub stars. Apache-2.0 licensed.
Maintenant
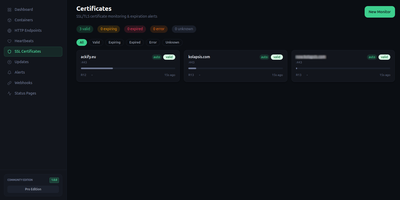
Maintenant replaces three to five separate monitoring tools with a single Go binary that consolidates container discovery, endpoint monitoring, SSL tracking, resource metrics, and public status pages without requiring any external database. The embedded Vue 3 frontend serves on port 8080 immediately after deployment, auto-discovering Docker containers and Kubernetes pods through direct socket and API access without configuration. HTTP and TCP endpoint monitoring validates availability with configurable intervals, while TLS certificate tracking alerts before expiration across all monitored domains. Resource metrics collect CPU, RAM, network throughput, and disk usage per container with real-time Server-Sent Events streaming to the dashboard. Heartbeat and cron monitoring accepts pings from external scheduled jobs, triggering alerts on missed check-ins via webhook callbacks and Discord notifications. The built-in alert engine supports escalation rules and notification batching. Public status pages expose component health to end users without authentication, customizable per monitored service. Network security insights analyze exposed ports, container privilege levels, and host configuration to produce a posture score. Update intelligence scans OCI registries to detect available container image updates with digest comparison. The REST API with SSE broker enables automation, and the integrated MCP server provides tooling for AI assistant integration. SQLite in WAL mode stores all data with zero operational overhead. Running on a dedicated VPS on RepoCloud with guaranteed CPU, RAM, and SSD, full root SSH access, and a browser serial console. AGPL-3.0 licensed.
Breeze
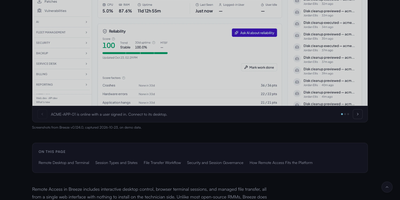
Breeze is an open-source RMM and PSA platform for MSPs that watches every managed device, and its built-in AI operator investigates alerts and drafts fixes for your approval. See live CPU, memory, disk, and network health for the whole fleet, with hardware and software inventory on every Windows, macOS, and Linux endpoint. Approve and deploy operating system and application patches in rings and maintenance windows, or push scripts and software to hundreds of devices at once. Open a remote terminal, browse files, or take over the desktop with multi-display support when a user needs hands-on help. Network discovery scans each site for unmanaged devices, while configuration policies and drift checks keep machines aligned with your baseline. Tickets, time entries, quotes, and invoices live beside the device work, so a resolved issue becomes a billable record without a second system. Clients get their own portal to raise requests and follow progress, and the multi-tenant structure keeps every customer separate from day one. When the AI operator acts, tiered approvals and a full audit log show exactly what it did and who allowed it. Running on a dedicated VPS on RepoCloud with guaranteed CPU, RAM, and SSD, full root SSH access, and a browser serial console. AGPL-3.0 licensed.
OmniSight
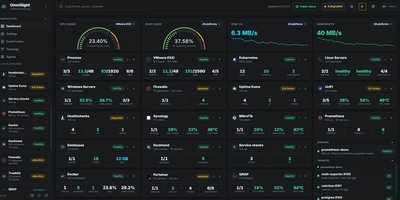
OmniSight ends the homelab ritual of a dozen admin panels open in a dozen tabs, each with its own login and its own idea of what healthy looks like. It folds all of them into one page that answers the only question you actually have: is everything fine? Watch Proxmox nodes with their VMs, containers, backup status, and Ceph health next to VMware hosts and datastores, Linux and Windows servers, and Kubernetes pods with live log viewing. Add Docker hosts and see container status, ports, resource use, and image updates, check OPNsense firewalls, TrueNAS and QNAP storage, and PostgreSQL, MySQL, and MongoDB databases without leaving the dashboard. A small push agent installs with one copied command and self-registers within seconds, needing no inbound firewall rules, so machines behind NAT report in on their own. Follow relationships on the topology map, restart a service from the detail view, export a full backup, and publish a read-only public status page for anyone who asks how things are running. Running on a dedicated VPS on RepoCloud with guaranteed CPU, RAM, and SSD, full root SSH access, and a browser serial console. GPL-2.0 licensed.
Netdata
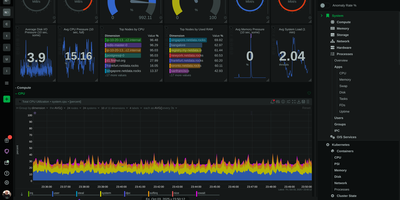
Trusted by millions of engineers and deployed on over 80,000 GitHub stars worth of community confidence, Netdata delivers true real-time monitoring at per-second granularity — 10-60x faster than Prometheus, Datadog, or any conventional monitoring stack that averages away the transient anomalies lasting 2-10 seconds where most production incidents originate. A single installation command deploys the agent with zero configuration, automatically discovering every running process, container, systemd service, network connection, disk, and application on the host within seconds. Unsupervised machine learning trains multiple models per metric directly at the edge, detecting anomalies without thresholds, baselines, or manual tuning. The distributed Parent-Child architecture scales horizontally from a single Raspberry Pi to fleets exceeding 100,000 nodes while maintaining sub-2-second visualization latency and storing metrics at approximately 0.5 bytes per sample through tiered compression. Native network monitoring provides live topology maps, NetFlow and sFlow analytics, SNMP device polling across 200+ profiles, and trap handling — capabilities that typically require a separate NPM product. Hundreds of pre-configured alerts cover systems and applications out of the box, with AI-powered root cause analysis surfacing correlated metrics through natural language via MCP-compatible AI assistants. The agent supports Linux, macOS, FreeBSD, Kubernetes, and Docker with eBPF-based kernel observability requiring no application instrumentation. Running on a dedicated VPS on RepoCloud with guaranteed CPU, RAM, and SSD, full root SSH access, and a browser serial console. GPL v3+ licensed.
Open SEO Crawler
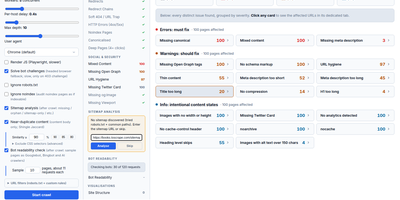
The audit starts with one URL: Open SEO Crawler spiders the entire site from your own server and groups every technical issue by severity. It crawls concurrently with per-host politeness and backoff retries, and presets adapt automatically to WordPress, Shopify, Webflow, and seven other detected CMS platforms. Every page gets checked for missing or duplicate titles, meta descriptions, H1s, and canonicals, plus thin content, redirect chains, broken links, hreflang gaps, and images without alt text. Afterwards, sample pages are fetched again as Googlebot, Bingbot, Applebot, GPTBot, and PerplexityBot, and any page a bot cannot read in full gets flagged. The Summary groups issues into errors, warnings, and info with affected page counts, and the sidebar opens bulk reports for titles, metas, canonicals, duplicates, response codes, and deep pages. Each report exports to an XLSX workbook, and the Crawl Budget page turns parameter traps into ready-to-paste robots.txt rules that stop phantom URLs from eating your budget. One click packs the crawl into a Markdown brief for any AI assistant, and the bundled MCP server lets Claude or Cursor start crawls and read issues directly. Saved crawls reopen any time, dark mode is built in, and a daily auto-update keeps the tool current with rollback if a pull ever breaks it. Running on a dedicated VPS on RepoCloud with guaranteed CPU, RAM, and SSD, full root SSH access, and a browser serial console. MIT licensed.